

by Rik Keller
This article presents data documenting housing growth rates and cost increases for the U.S., California, and the Sacramento–Roseville–Arden-Arcade MSA (Metropolitan Statistical Area; consisting of El Dorado, Placer, Sacramento, & Yolo counties) as a whole, as well as selected jurisdictions within the MSA and neighboring jurisdictions in Solano County.
The purpose of presenting this data is to provide context for land use policy discussions and to place local growth characteristics of Davis in context with the greater region. There are mistaken assumptions and falsehoods not supported by evidence that are frequently repeated in such discussions, and my hope is that this compilation of statistics will help guide discussion about the challenges our community faces with an eye to a balanced approach that includes a careful examination of evidence.
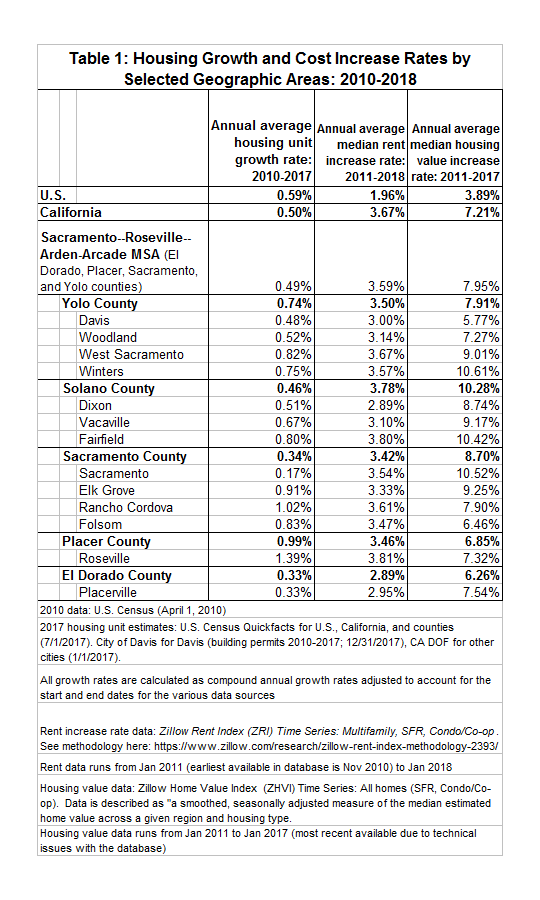
The data in Table 1 shows annual average housing unit growth rates from 2010 to 2017, along with average annual median market rate housing rent increase rates from 2011 to 2018 and average annual median house value increase rates from 2011 to 2017. See detailed notes below the table for sources used and explanation of the time periods. The data used is the best available to the author.
Figure 1 is a chart showing housing unit growth rates by geographic area on their own. Figures 2 and 3 show X-Y scatter plots with the housing growth rates plotted in the x-axis compared to housing rent increases and housing value increases, respectively, plotted in the y-axis. These are intended to show direct comparisons between the two sets of data, along with patterns and trends.
The following is a brief summary of several conclusions looking at the data focused on Davis. I hope that this article and data stimulate further discussion far beyond these few observations.
- Davis had an annual average growth rate for housing units of 0.48% from 2010-2017. As shown in Figure 1, this growth rate was very close to the rate for the United States as a whole (0.59%), California (0.50%), and the 4-county Sacramento MSA region (0.49%), as well as neighboring communities such as Woodland (0.52%) ,and Dixon (0.51%), and Solano County (0.46%). The housing growth rate in Davis was higher than Sacramento County (0.34%) and the city of Sacramento (0.17%), but lower than West Sacramento (0.82%). Placer County had the highest growth rate among counties in the region (0.99%), with the city of Roseville (1.39%) having the highest rate of increase in housing units.
- There were only two jurisdictions (Rancho Cordova and Roseville) that had annual housing growth rates higher than 1% from 2010-2017. This is of particular note because the City of Davis has an annual housing growth rate “policy guidance” of 1% that “represents a cap that is not to be exceeded except for units that are specifically exempted or allowed by the City Council as an infill project with extraordinary circumstances and community benefits” (source: City of Davis). As shown in the table, this 1% cap does not represent a limit to development in Davis compared to existing housing growth rates in the region that are generally far below 1% and projected to stay at low levels in the future.
- As shown in Figure 2, Davis experienced one of the lowest rates of rent increases in the region from 2011-2018. The city of Roseville had the distinction of having the highest rate of rent increases while it also had the highest rate of housing unit construction. It is often said in certain quarters that an increased housing supply is needed for greater housing affordability [For example, see this article published two days ago in the Davis Vanguard that called housing construction “the engine of affordability”: https://davisvanguard.org/2018/10/commentary-cant-build-blocked-litigation-rent-control-answer/] However, in Roseville’s case it is clear that the engine of housing construction has gone hand-in-hand with the highest rate of rent increase in the region.
- Similarly the Davis Vanguard and the development community in Davis often make statements suggesting that the City of Davis’ growth management land use policies make housing less affordable. The data shown in this article demonstrates that this simplistic viewpoint is misleading. While the housing supply in Davis has grown at rates similar to the region as a whole, Davis has experienced rent increase rates much lower than the regional average.
- Figure 3 shows that Davis also experienced THE lowest rate of housing value increase in the region from 2011 to 2017. This reinforces the above point and calls into question the idea that growth constraints in Davis have led to large housing price increases. Meanwhile, communities such as Elk Grove, West Sacramento, and Rancho Cordova that had some of the highest rates of new housing construction also had the highest rates of housing price increases.
Rik Keller is a university instructor in communication studies and social work. He has 17+ years of professional experience in demographic analysis and housing policy & analysis in Texas, Oregon, and California after obtaining his master’s degree in city planning. He is also a 10+ year Davis resident and a current renter.
Get Tickets To Vanguard’s Immigration Rights Event

Rik – Did you consider running regression analyses, perhaps controlling for median home price in each city? Just from eyeballing the plots, it seems like rent and home value rate increases are lower in cities with higher property values. Or perhaps you could just graph the data using absolute dollar amounts.
Cindy: that scope would be way beyond the time I have available! I just wanted to provide a regional overview of some baseline characteristics of recent growth as a starting point. It would be great if someone took this farther!
My first impression without digging into the numbers more is that I don’t think that your theory is supported by the data. Roseville, especially, has some of the highest housing values in the region, along with the highest growth rate and the highest increases in rents and house values.
At least with respect to apartments, this is not supported by the data for rent from the UCD housing report.
Don, I appreciate all the great housing posts you have made over the years, but it is important to remember that the rental growth percentages Rik is posting from Zillow is for ALL rental housing in Davis not just APARTMENTS (that are mostly professionally managed). The UC apartment survey is great information but it just covers apartments with almost all of them managed by rental management professionals. As I’m sure Don is aware there are about 28,000 “housing units” in Davis and the UC Apartment survey only tracks the rent on 10,000 of them. Just like if I took a survey of 28,000 runners about their improvement in 10K times since 2011 and got a response from mostly the young thin runners with professional coaching (aka the smaller newer apartments with mostly professional management) I would see a lot more improvement over the years than from the older bigger self coached runners (aka the majority of homes and condos in town that are self managed by people like Howard, Tia and myself who just want to keep the place full so the mortgage is paid and we don’t have to deal with finding a new renter)…
We have no evidence that it even includes apartments. It doesn’t appear to.
Don: The chart you posted at 9:46 a.m. (below) appears to show that Zillow is, in fact, including apartments in its rental price calculations.
Zillow does not show actual rents. It only shows estimated potential rent values. While I was renting for 9 years, I found that the Zillow rentals were not accurate for actual rents reported for the same houses that I was looking at.
Zillow shows actual places for rent, as well.
In any case, there are no significant differences in the rate of rent increase in any of the communities that Rik compared. Rent has increased across-the-board, even in communities that have allowed more development.
And, in reference to the chart that Davis posted, the amount of development that Davis has approved isn’t much different than other nearby communities.
Honestly, I have no idea what the development activists are trying to “prove” by commenting on here. The data doesn’t seem to back up any of their claims.
Ken makes a good point … one that is borne out by the information/data that BAE (Bay Area Economics) has provided to the DPAC in the Downtown Davis Existing Conditions report, which says “According to 2016 figures, Davis has about 26,000 housing units with an average occupancy of 2.7 persons per household. 46% of the housing is owned and 54% is renter-occupied.”
Some quick math (26,000 times 54%) means there are just over 14,000 renter-occupied units in Davis.
The 2017 Apartment Vacancy and Rental Rate Survey (done for UCD by BAE) says:
.
What that appears to indicate is that just under 4,000 of the renter-occupied units are not covered by the apartment complexes and property management companies that responded to the survey. 4,000 out of 14,000 represents 28%. Said another way, Don’s numbers only represent 72% of the picture.
Within which group, the rental increases have been as follows:

So I guess rental increases in the remaining rental units have been very, very low.
You don’t have to “guess”, Don. Zillow’s calculations show exactly that (in aggregate, for the total rental market – including apartments, as noted elsewhere on this page).
Another reader sent me this: “The problem with Rik’s analysis is that he starts in 2011 near the bottom of the housing market. Since Davis didn’t fall as much as other towns it hasn’t gone up as much either. A longer term analysis going back to the passage of Measure J or a shorter term analysis looking at rent increases in the last few years would likely yield a much different picture.”
So why don’t you tell us who sent this to you? Is there a “super-anonymous” list , hidden from the rest of the forum or is this one of your “anonymous sources?
It was someone who had a question who didn’t want to post
“The problem with Rik’s analysis is that he starts in 2011 near the bottom of the housing market. Since Davis didn’t fall as much as other towns it hasn’t gone up as much either. A longer term analysis going back to the passage of Measure J or a shorter term analysis looking at rent increases in the last few years would likely yield a much different picture.”
I don’t see a question. That is clearly a comment. I see you preferring a completely anonymous “friend” over not only those who post under their real names, but your selected and protected locals.
I want to thank Rik for his post and especially for all his footnotes. As a certified geek I spend a lot of time trying to understand (and backwards analyze) the Zillow value algorithm (like I spend a lot of time trying to understand and backwards analyze the top 25 college admission process).
I now understand that Rik’s data is good stuff and super accurate for ALL rentals and ALL homes. Most people just talk about the value of homes that actually sell (more often than not with tens of thousands of upgrades) not ALL homes. The Apartment rent and vacancy survey tracks and impressive percentage of apartments in town but not ALL homes and apartments so it shows the rents higher and vacancy lower than it really is since most people that respond to the survey are professional management companies not “mom & pops” (who rent most homes and duplexes in town) who don’t have a “maintenance staff” and have higher vacancy and almost 100% of the time have lower rents.
With respect to apartment rentals, Rik’s data is not merely wrong. It is egregiously wrong and misleading as a result. This is the only data he’s presented that I am able to fact-check readily with data that I already have at hand, as I posted above. Unfortunately, it nullifies his assertion regarding rental housing and calls into question the accuracy of not just this essay but all of his presentations on the Vanguard that are comprised of data and charts. He’s clearly wrong about the most important housing issue in Davis — the availability and cost of rental housing. I’ll just have to consider anything else he posts to be invalidated until fact-checked, and I don’t usually have the time or data at hand to do that.
This essay seriously undermines Rik’s credibility, in my opinion, since he has the UCD housing survey available, knows that it is a more significant indicator of the local housing issues, and chose not to use it.
Just to reiterate, his assertion that “Davis experienced one of the lowest rates of rent increases in the region from 2011-2018” is either false or misleading, depending on how you look at it. The data points that really matter in our local housing discussion are the stubborn 0.2% apartment vacancy rate and the high rental rate increases over the last several years.
Don: it is not my data. It is the ZRI time series data. You can easily fact-check it independently yourself. And you can read about their methodology. I suggest you do that before you start throwing out your hot-headed accusations.
Since the average rent increase in the last five years has significantly exceeded 5%, I don’t need to check your methodology to know your conclusion in that regard is incorrect with respect to apartment rentals. Since Davis has a far higher percentage of renters than owners compared to all of your other communities, and apartments are by far the largest source of rental units, I am not incorrect in dismissing your data in that regard. I’m being charitable by calling it misleading. I suggest you avoid characterizations such as “hot-headed.” My answer was based on statistics that are readily available to you.

Here is how Davis differs from the other housing markets in the region:
What matters here is the apartment vacancy rate and what is happening to rents in multi-family units.
http://davismerchants.org/vanguard/Zillow%20home%20rental%20estimate%20chart
Based on the rental index shown here, https://www.zillow.com/davis-ca/home-values/
Zillow does not appear to include multi-family housing units in their Davis Rentals index. So in a city that has the highest rental rate in the region, the preponderant form of housing unit is not apparently included in the Zillow index of rental cost.
Don: When looking for a place to rent, do students limit their searches to apartments, only? Especially in a community that has a “far higher percentage of renters, than owners” – as you noted? If not, then looking at rents from those apartment owners who responded to the campus survey will be far more misleading than looking at the entire rental market.
Here’s some of what’s available right now, in the 95616 zip code (apartments and regular homes):
https://www.zillow.com/homes/95616_rb/
Check out the very first listing (3 beds, 2.5 baths) near downtown for $2,300.
Here’s the results of a Craigslist search:
https://sacramento.craigslist.org/search/apa?query=davis&availabilityMode=0&sale_date=all+dates
Give ’em a call and see if it’s actually still available, and be sure to ask how many applicants they already have for it.
I see that Don didn’t bother answering the question.
I had an employee last year crew was looking for a place in Davis and everyplace she applied for there was a long list of applicants so what appeared to be available functionally was not
David and Don:
The article references price increases, not vacancy rate. (Come to think of it, the vacancy rate likely does not include houses or rooms for rent – in houses or apartments.)
I would think that listings are normally removed from Craigslist, for example, when rented. (More so for houses and rooms, I expect. It’s not likely that those folks would want to continue to be contacted, in such cases.)
Seems to me that the statistics that Rik cited are far more accurate (than the campus survey) regarding the total rental market.
Also, for some unknown reason, it appears that Don posted a link to a home value index (above), when arriving at an unsupported conclusion that multi-family housing was not included in Zillow’s rental price calculations.
You are apparently wrong about that.
Scroll down for the rental index.
Don, the rent at my rental home (my old home in East Davis) is $100 higher than is was 5 years ago, an average increase of ~1% per year (It was $2,200 for three years and I increased it to $2,300 when the current people moved in). I probably could get a little more, but I want to price the place where I have a lot of people apply and pick the best people who I hope will stay a while. Below is a link to a 3 bedroom HOME in East Davis asking $1,995 (the “average” 3 bedroom APARTMENT rent in last year’s UCD report was $2,270 with a high 3 bedroom “apartment: rent of $2,850) .
https://sacramento.craigslist.org/apa/d/1615-st-property-management/6703843340.html
I was just going to post the same thing (so it’s not anonymous). In addition, the larger Sacramento region had a substantial excess supply of housing by 2007, which is in large part what led to the housing value crash. So obviously, areas outside of Davis, which has a much more constrained housing supply since 2000, would not have built as many houses to meet the rebounding demand.
The appropriate measure is start back at 2000 when Davis imposed its growth controls. I posted the data on population growth earlier showing that Davis has substantially lagged the Sacramento MSA since 2000. This is the key metric on housing demand.
2000
2010
2017
Sacramento MSA
1,796,857
2,149,127
2,324,884
Annual growth Rate
1.81%
1.53%
Davis
60,308
65,590
68,986
Annual growth Rate
0.84%
0.79%
Davis @ Sac MSA Rate
72,131
84,864
Shortfall
6,541
15,878
Don: since you are so worked up about it, you should probably write an angry note to these folks for using the same datasets.
http://www.efp.ucsb.edu/data/sources
”Zillow Research Data provides frequent housing data (monthly, with a delay of only a few weeks) for very specific geographic locations (neighborhoods, zipcodes, cities, counties, MSAs, States, and the U.S.). For particular homes, Zillow may not be entirely accurate, but after aggregating over zipcodes, cities, or the entire country, the Zillow Home Price Index (ZHVI) is accurate and adjusts for many of the problems that occur in other home price data like the California Association of Realtors (CAR) data and the Case Shiller Home Price Index.”
Don:
Will you likewise write a pronouncement about the Economic Forecast Project at UC Santa Barbara that I linked to above saying, as you did to me, that their use of that ZRI and ZHVI data “to be invalidated until fact-checked” and that it “seriously undermines [their] credibility]”?
I am not “angry” or “worked up” about this, Rik. I really suggest you stop with the ad hominems.
I presented data about the apartment rent increases in Davis that basically nullifies your assertion about rent costs. Can you verify that the data you posted includes apartment rents? If not, please get back to us when you have a comparison of the five-year trends in apartment rents in the cities you listed.
Zillow’s data is useful if you are thinking of relocating to Davis and want to rent a home. It doesn’t appear to tell us anything about the multi-family housing rental market, which is the preponderant rental housing in a community that skews very high toward rental vs. ownership.
Don: In addition to the table that you personally posted at 9:46 a.m. (which shows that apartments are apparently included in Zillow’s rental price calculations), see the following (with emphasis added by me):
http://zillow.mediaroom.com/2011-03-10-Zillow-Expands-Zestimates-to-Include-Rentals-Launches-Rent-Zestimates-for-90-Million-Homes
Great! Get back to us when Zillow Zestimates for Yolo County gets more than two stars.
https://www.zillow.com/howto/DataCoverageRentZestimateAccuracyCA.htm
Don,. your comments in this thread are predominantly personal attacks on Rik … rather than engaging the fact that the BAE-administered UCD apartment survey only represent 72% of the picture.
That doesn’t make the UCD apartment survey incorrect or invalid (and Rik has never said that it was), it just makes it limited/focused.
You are the one who has made this personal. You are the one who has used prejorative terms like “not merely wrong” “egregiously wrong and misleading” “calls into question the accuracy of not just this essay but all of his presentations on the Vanguard” “seriously undermines Rik’s credibility”
You unilaterally set the standard of accuracy as “fact-check readily with data that I already have at hand” which is nothing more than a Rumpelstiltskin rant that “my data’s better than your data. My data’s better than yours. My data’s better because it eats Kennel Ration. My data’s better than yours.
And of course that is not an ad hominem attack against Rik. 8>) In my personal opinion, your long-standing personal passion about rental housing in Davis is overwhelming your objectivity.
Matt’s comment (to Don):
Thanks for pointing this out, and was thinking the same thing. Is this really the standard that Don wants to promote on here?
Frankly, Don should apologize to Rik for this.
I hope Don and Rik both know that even with a survey of EVERY rental unit with a notarized copy of a tax return we will still not know that actual rents in town (some people collect rent in cash and don’t want anyone to know how much they are charging). The UCD housing survey has a higher rent and lower vacancy due to a oversample of newer and renovated professionally managed apartments and the Zillow housing survey has a lower than average rent and higher than average vacancy since it has an oversupply of “mom & pop” managed homes. The actual rent increases for ALL rental units are probably a little lower than in the UCD number and a little higher than the Zillow number…
Actually, I’m not seeing anything to support this statement, either. Zillow is apparently providing an aggregate estimate of the total rental housing market. One would have to examine their methodology in detail, to accurately critique it.
Don: you really need to read up on the methodology. Zillow “Zestimates” are provided for individual properties.
On the other hand, the ZRI and ZHRI indices are aggregate datasets using a robust, well-respected methodology that is considered the gold standard in the field.
Ron said: “Frankly, Don should apologize to Rik for this.“
I agree and have sent a formal request in this regard.
One step farther: Don has denonstrated that he lacks the temperament and judgement to moderate a public discussion forum like this, and he should immediately be removed from that role.
Again, Zillow does not provide ACTUAL rents. It calculates estimates rents based on house values. While the house values are reasonably accurate, I have found that the rental values are usually off by several hundred dollars a month. I was in the Davis rental market for 9 of the last 10 years, and I would check Zillow rents against listed rents for 3+ bedroom houses.
Again, that is factually incorrect. Here are some listings, with ACTUAL rents:
https://www.zillow.com/homes/for_rent/davis,-ca_rb/?fromHomePage=true&shouldFireSellPageImplicitClaimGA=false&fromHomePageTab=rent
Regarding estimated rents:
https://www.zillow.com/research/data/
Richard McCann said: “Again, Zillow does not provide ACTUAL rents. It calculates estimates rents based on house values. While the house values are reasonably accurate, I have found that the rental values are usually off by several hundred dollars a month. I was in the Davis rental market for 9 of the last 10 years, and I would check Zillow rents against listed rents for 3+ bedroom houses”
This statement is not true. As described in their methodology, ZRI Time Series data that estimates rents based on actual rent listings, and then applies machine learning algorithms to determine estimated rent levels for the broad range of housing in a geographic area.
The Zillow ZRI and ZHVI TIME Series indices are commonly used by demographers and housing researchers and are considered as two of the “gold standards” in the field.
Here’s why the Economic Forecast Project at UCSB prefers the ZIllow indices: http://www.efp.ucsb.edu/articles/zillow-vs-dataquick
Here’s a data sheet on the advantages of the ZHVI (house value) index compared to other sources: http://cdn1.blog-media.zillowstatic.com/3/ZHVI-InfoSheet-04ed2b.pdf
…Meanwhile in the other article published in the Davis Vanguard today, we get David Greenwald continuing to write things like the this “The other factor here, some will argue, is that growth control policies have made new single families homes more scarce and have helped to maintain the high costs..”
In general, I’ve read that when home prices rise (e.g., in the Bay Area), it can actually make more financial sense to rent. This is due to a progressive “disconnect” between the value of a home, vs. the price it will bring in rent. (Rents don’t rise as fast as home prices.) I can probably find articles showing this, if needed.
And, at some point, some folks realize they’re paying too much (either way), and move to areas where salaries are more closely aligned with housing prices. (Perhaps to locations where it isn’t routinely 100 degrees or more, during the summer (e.g., to a location that is also less congested and with a little more varied topography, as well).
This data matches my general opinions and observations related to housing costs in the region during this span of time. However, it is a bit disingenuous to make arguments that Davis is somehow “not that bad” when the real story requires looking at comparable data beginning before 2009 when real estate values crumbled.
Davis real estate started high but did not decline too much after the crash.
However, every other surrounding community saw an average 35-40% decline in real estate values. I believe in Davis we had a 10-15% decline.
So these other communities would obviously show a steeper post Great Recession increase in real estate costs (including rents which are a function of purchase costs).
Lastly, new housing generally costs more than old housing and generally rents for more than old housing. The reason is that CA construction costs over the last 20-30 years have significantly exceeded the rate of inflation due to added code requirements and fee increases. Also land use restrictions has decreased the supply of develop-able land and thus inflated the cost of land where development is possible.
So these other communities had built a lot of housing before the crash while Davis did nothing, and the newer housing drives higher rents.
However, in generally I have noted many of the communities surrounding Davis have seen higher real estate value appreciation. I had considered moving to Sacramento in 2002 and noted how much more house I could get for the money. Today in those same neighborhoods I was interested in, housing costs have moved much closer to those in Davis. These other neighborhoods and communities are catching up with Davis… probably because Davis is in decline with traffic, congestion, crappy roads, crappy entertainment, too few retail options, and older/crappier housing on small lots surrounded by mini-dorms.
Per the data shown, Davis is at 3.00% increase from 2010 – 2017.
The UCD housing survey shows an average of 5.73% for the housing units covered by that study between 2011 and 2017.
Matt calculates the UCD numbers as covering 44% of the rental housing stock in Davis. In order for them to be at 5.73%, and the overall average to be 3.00%, I believe the remaining 56% would have had about a 1% increase in rent over the same time period.
Do you consider that likely? That the rental houses and the rental units not covered in the UCD housing survey increased at only 1% annual average over that same time period?
I think a likelier scenario is that Zillow is not a robust data source with respect to rental costs or increases.
The link Ron provided shows us that Zillow is not really a resource for rental information yet for Yolo County. By comparison, the UCD student housing survey uses clear methodology and has given excellent year to year comparisons for the rental housing covered. As noted, that is a large percentage of the multi-family rental housing in the city.
So Rik’s conclusion is inaccurate, based on what we have to work with. His response has been ad hominems and deflections. If I were in Santa Barbara having a debate about housing policy there, I’d inquire as to how reliable Zillow is for rental information there. It doesn’t appear to be a reliable resource here. That’s not really an answer as to why his data is so far removed from the actual reported rent increases we have available to us.
Which link is that, and how did you arrive at that conclusion? And, is it also inaccurate for the other communities that Rik compared Davis to, using the same source?
You’ve shown no such thing. This has been pointed out to you a number of times, by a number of commenters.
You also (repeatedly and inaccurately) concluded that the source that Rik used did not include apartments. You have yet to acknowledge that you are wrong about this, nor have you apologized to Rik for your personal attacks.
This one:
https://www.zillow.com/howto/DataCoverageRentZestimateAccuracyCA.htm
I don’t know, and consider that irrelevant. We are discussing rental rate increases in Davis.
See my 1:10 pm post.
The reference that you’re referring to shows that the Zillow estimate for Yolo county was within 20% of the rental price (in either direction), 80% of the time.
I don’t know why you’d consider other communities “irrelevant”, when the point of Rik’s article was to compare rental price increases between these different communities, and to show that rental price increases are not directly correlated with new housing development.
At this point, it’s unclear what you’re even arguing.
Regarding your 1:10 p.m. post, it does not address the point. The data that Rik is using includes apartments. (Probably about the 5th time that this has been pointed out to you, by now.)
That his data with respect to Davis rental increases is likely inaccurate, and that his conclusion on that subject is unfounded for that reason.
Don: you said WAY more than that. You are being completely irresponsible with baseless allegations on a public forum that you supposedly “moderate.”
I was summarizing for Ron, since he seemed to be losing track. If you have a complaint about me, send it to David. I will not be apologizing to you, and I suspect it is likely that I will be moderating the Vanguard for some time to come. Ordinarily discussions about moderation practices are off topic and removed, but I’ve left your comments so that you could register your objection publicly about something I have said. That only seemed fair in this case.
I urge that we get back to the topic at hand. I have pointed out a serious discrepancy in your data compared to another data set. If you’ve got something that clearly demonstrates that rental housing is included in the Zillow data set, let’s see it. I couldn’t find it on Zillow’s page. If you’ve got an explanation for why the apartment rental rate increases are so much higher than the 3.00% rate you posted, let’s see the evidence.
Relying upon a UCD survey which only includes a portion of the rental market (and only includes one type of rental dwelling) is “more than likely” to be inaccurate, regarding the aggregate rental market. (That applies to both rental prices and vacancy rates.)
Do you really want to argue this, further? I’d suggest acknowledging your error, and apologizing to Rik for the personal comments you made. Again, other commenters have made similar suggestions to you, as well.
Certainly. The Davis market contains a much higher proportion of rental housing overall, and a much higher proportion of multi-family rental housing specifically, than any of the other communities being compared. It is a very skewed market. As I’ve noted, the overall rental increase for the rest of the rental market would have to be far below the regional average in order for the UCD increase rate to average with it to 3.0%. Far below. That seems unlikely to me. Do you think it’s likely?
Again, that’s accounted for in the data that Rik is using. If anything, the high number of apartment units in Davis should result in higher aggregate rent increases in Davis (if apartment rents are actually increasing faster than other types of rental housing), compared to other communities (where there are presumably fewer apartments). But, as shown in the charts that Rik posted, that’s clearly not the case.
Perhaps it’s better to refrain from “guessing about likelihoods” (as if that’s some form of “evidence”) when presented with data that disputes long-held personal beliefs and agendas.
Don said: “If you’ve got something that clearly demonstrates that rental housing is included in the Zillow data set, let’s see it”
I used the Zillow Rent Index (ZRI) Time Series that includes “Multifamily, SFR, Condo/Co-op” housing.
See: https://www.zillow.com/research/data/
I downloaded the spreadsheets from that and other links, and do not find any month-to-month data for Davis or 95616 for the whole time period. So while they have a figure for Davis at City_Zri_AllHomesPlusMultifamily_Summary and Zip_Zri_MultiFamilyResidenceRental, they don’t have anything for Davis until March 2017 at Zip_MedianRentalPrice_AllHomes which is their month-to-month spreadsheet.
This is their description of the Zillow Rent Index:
Operative notes:
“easier to compare the ZHVI and ZRI since they are based on a similar set of homes”
and
“we estimate rents….”
Yes, they are obviously compiling lots of data about lots of regions. But there is nothing there to indicate if or how they include multi-family housing in their proprietary formula.
Don: As previously pointed out, the table you posted at 9:34 a.m. shows that the Zillow Rent Index (ZRI) includes multi-family rentals. As you noted, they use a proprietary formula.
Woops – I meant to say 9:46 a.m.
As a quick follow-up: I was surprised that the ZRI/ZHVI data showed what it did. A relatively large rent and housing value increase in Davis compared to other areas would be predicted and would be easily explainable by the large exogenous demand from the overflow of students from spiraling enrollment rates at UC Davis that the University has not been housing it fair share of in the past 18 years, and especially in the last 8 years. The Davis Vanguard “house” position though is to try to blame all ills on City of Davis growth management policy.
Part of what might be happening to explain discrepancies in various data sources in terms of rent increases is that Davis rental rates could be more volatile up and down related to student demand and pressures. So, depending on what point-in-time is used as starting point and ending point it might accentuate or reduce change over time. I picked January 2011 as a starting point for the rent data because that is right at the start of the series and then I carried it forward to January 2018. I didn’t investigate change over time for specific time segments. That might reinforce the same story or say something else.
I started to look at the ZRI Time Series data broken down over time from late 2010 to August 2018 for a few selected communities, and I have several brief observations:
– unlike some other communities, Davis had a decline in rents over the very first part of this time period for over half of a year (although California as a whole had a decline then too)
– then rents in Davis increased at approximately the same pace as other expensive communities in the region (such as Roseville, Folsom, and Fairfield) and California as a whole too–though with more volatility–for about the next 4.5 years up until the start of 2016 or so
– then Davis rents started to increase at a much higher rate than some other places in the region from 2016 to late 2017.
– rents have leveled off again in Davis in the past year
So, at least from this initial look at a few data points, it is in that 2-year stretch from the start of 2016 to the start of 2018 that Davis rents have shot up. I think that tells a far different story than the one that the Davis Vanguard keeps repeating that our growth management policies have caused rent increases beyond regional averages. It seems to me it is directly related to and being driven by student housing demand because of massive UC Davis enrollment increases.
No question about that.
well, let’s close this thread right now then before any disagreements rear up!
I think we can sum things up by saying we all know rents and home values have been going up in Davis since 2013 (the exact percentage increase per year depends on what properties are in the survey). I think we can also agree that it is harder to find a rental in Davis than most other areas of the region since UC enrollment has been growing faster than the number of beds in town.
It seems like the disagreement is if the traditional “supply and demand” rule applies to Davis or Davis is so “special” that even if we build 20,000 more homes and apartment rents will keep going up and vacancy will stay low as Bay Area residents cash in and move to Davis where they will never have to endure another chilly foggy summer evening…
Ken, I believe that Bay Area residents cashing in and moving to Davis where they will never have to endure another chilly foggy summer evening is only one of the supraregional components of housing demand for Davis.
A second group of supraregional housing demand, which I believe is even higher than the Bay Area residents group, comes from UC Davis alumni who have made their fortune elsewhere and want to return to the home of their idyllic college experience.
A third, more modestly sized group are retiree relatives of existing Davis residents and/or children and grandchildren of existing Davis seniors who want to live near their parents/grandparents.
I’d like to thank Rik for (once again) putting in the significant time and effort required to present and analyze data (that would otherwise not be widely known, and which sometimes conflicts with the usual Vanguard drumbeat).
One of the few commenters on here who consistently makes such an effort.
As Ron and other have pointed out, there are a lot of caveats to relying on the Apartment Vacancy and Rental Rate Survey data from the UC Davis Office of Student Housing (and BAE since 2012):
1) Population of the survey universe: as the title declares, this data is for apartments only, not houses/duplexes/condos that are rented out.
2) Response rate. The 2013 report states that in 2012, “the Office of Student Housing mailed 177 paper surveys and received 101 responses, representing 7,798 rental units.” and “Estimates from the American Community Survey (ACS) indicate that there were approximately 11,718 multifamily housing units located on the UC Davis campus and in the City of Davis, between 2008 and 2012.” So the 2012 survey only accounted for about 66% of the multifamily housing stock. And the survey only had a 57% response rate.
3) Note that the above text refers to the UC Davis campus. It is unclear when the survey might have included UC Davis apartments and when it might have stopped (my understanding is that the 2017 survey at least only applies to properties within the city, not on campus).
4) the survey only includes apartments with market-rate rents and excludes any subsidized units.
5) footnote on page 5 of the 2013 survey: “Average rental rates [for bed leases] were calculated based on the rental information provided by survey respondents. In cases where the respondent provided a range of prices, but no associated unit totals, BAE utilized the mid-point of the range as the assumed representative value….The figures exclude some complexes that did not provide full details on the number of units and/or bed leases, and/or lease rates.”
I just remembered that there’s been a number of recent articles showing Sacramento as having one of the fastest rental increases in the entire country. Here’s one source, showing data back to 2011. The source shows that average Sacramento rents increased by 6.71%, from last year:
https://www.rentjungle.com/average-rent-in-sacramento-rent-trends/
However, the same website shows that Los Angeles rents increased by an average of 10.46%, since last year. (I guess that Los Angeles still doesn’t have “enough” housing, according to the arguments presented by some on here.) 🙂
Ultimately, allowing vacancy rates, rental or housing prices to guide decisions regarding how much development should be allowed is not sound planning, in my view. For those who nevertheless prefer the “Los Angeles development model”, it seems that even this does not offer protection against rent increases.
Surprisingly, the website also shows annual rent changes in Davis apartments, as well. Looks like they increased at a slightly faster average rate (7.26%) than Sacramento’s rate, for last year. Interestingly, one-bedroom apartment rents in Davis decreased by 14.31% last year.
https://www.rentjungle.com/average-rent-in-davis-rent-trends/
It appears that the percentage of rental increase in Davis (since 2011) is less than the comparable percentage increase in Sacramento during that same period.
Just like Davis has a lot of people coming here to attend UC Davis (and few students “buy” homes) Los Angeles has a lot of undocumented people coming to work from south of the border (and few undocumented workers “buy” homes).
P.S. The minimum wage in Mexico is $4.70 a DAY $0.59/hr (so at the current CA minimum wage they make more working one day in CA than they make working two WEEKS in Mexico (next year they will make almost 20x more at the new $12/hr CA minimum wage. To put things in perspective just think how many “undocumented” American people would be sneaking across the border into Canada if their minimum wage was $235/hour (19.6x higher like we are to Mexico) driving up rent in Vancouver and other towns near the border…
https://www.mexperience.com/mexicos-minimum-wage/
“Ultimately, allowing vacancy rates, rental or housing prices to guide decisions regarding how much development should be allowed is not sound planning, in my view. ”
So you’re saying is that we should not allow the market to dictate how much housing to provide?
What is the “market” though? In Davis, due to skyrocketing admission rates at UCD, the rental market has been distorted by this exogenous housing demand that the University has not provided for.
Just to be clear, you’re saying that cities should continuously strive to approve development to accommodate market demand? What do you think the end result of that would be? (Assuming there is an “end result”?)
From your question, I’ll assume that you don’t support the one percent growth cap (based upon units), urban growth boundaries, Measure R, farmland/open space protection, vertical height limits, etc. All of these “hinder” efforts to respond to market demand.
The question above really gets to the heart of the matter, regarding those who somehow claim that they support measures that effectively constrain the ability to respond to market demand, while simultaneously stating that cities should continue responding to market demand.
It makes no sense. And, if those same folks come up with some kind of b.s. argument about a “balance” (which actually only exists in their own minds), then they’re not really supporting either point of view.
Did I say that “cities should continuously strive to approve development to accommodate market demand?” I think you might take a lesson from Tia here and not put words in other people’s mouths.
I’m sorry but I think a factor in planning has to be things like vacancy rates, rental and housing prices. What I did not state is how much weight or how far.
It was phrased as a question, similar to what you asked me. I haven’t yet seen a recent development proposal that you don’t tacitly support.
More importantly, what if your imaginary, personal, and undefined tipping point is never reached? All evidence shows that it never will be, as long as market demand is dictating response, goals and policy. (Not necessarily limited to Davis.)
Which is a weird comment because I was opposed to Trackside and I have stated I have issues with the current one and am not supporting it. Not sure exactly what that has to do with my comment though. Most of the recent proposals have been infill projects – which in general I have supported as opposed to peripheral sites – which in general I have not supported.
This thread started as a question to me, regarding whether or not market demand should dictate how much housing to provide. I then pointed out that there are factors which hinder the ability to do so, which are claimed to be supported by some of the same folks pushing for more development.
I then noted that these folks seem to have some undefined, squishy “personal balance” in mind, which doesn’t actually exist. It is entirely possible that market demand will never be met, which will “bump up” against goals to limit growth and development. (And, I’m pretty sure I know which one will continue to lose, in that case – in Davis, the region, the state, and beyond.)
I fully expect market demand will never be met. The question is how much of the demand should we reasonably attempt to meet.
We have SACOG guidelines, for that. Such guidelines exist throughout the state. I understand that many communities had essentially been ignoring them, entirely. (Davis is not one of them.)
Just curious as to what you view those “issues” are. Why would you not support the current Trackside proposal, and yet support WDAAC, for example?
Isn’t Trackside exactly the type of “infill” you support, while WDAAC is a low-density, sprawling, suburban-style development (as you’ve noted, as well)?
Again not supporting WDAAC. See the first article today.
I’ll look at it, but your article the other day seemed to indicate support for WDAAC.
Again, though (since you brought it up):
Given your general point of view, why do you not support the current Trackside proposal? Isn’t this exactly the type of infill that you normally support? (In fact, isn’t it a little less-tall than you might otherwise advocate for?)
Ron
“The reference that you’re referring to shows that the Zillow estimate for Yolo county was within 20% of the rental price (in either direction), 80% of the time.”
Whoa, this is huge error band! Considering that a 20% difference translates to a 2.7% difference in rent escalation over 7 years (and 5.4% if it its 40% off (20% above + 20% below))), this has huge implications.
Richard: The point being that (regardless of the source, or how it’s measured), there isn’t a large difference in the percentage of rent increases (or even the amount of development allowed) over the past few years between Davis and other communities. As you noted, the margin of error might even be overstating the amount of rent charged in Davis. (That’s why it’s important to review several years, instead of just one year. Rik did exactly that.) In fact, some other nearby communities had larger percentage rent increases.
Parse that however you want to. But, that’s what Rik’s article shows, as does the additional information provided in the comments.
David: I see that you still haven’t responded to my question regarding Trackside.
The point being, the data that supposedly supports that conclusion is not borne out by other evidence, and we don’t know how Zillow estimates their rent index. They use a proprietary formula that is contradicted by the UC housing survey. They don’t appear to use actual rent data.
And actually, I just noticed that Rik’s data shows that Davis experienced the lowest rate of increase in housing values over the period studied, as well. Significantly lower than the nearby comparison communities, as well as the state as a whole.
Seems like the story that the development activists keep repeating doesn’t hold up under scrutiny.
Davis housing lost the least value during the crash that immediately preceded the “period studied.” Starting your data point at 2011 really skews almost everything.
I started my analysis where the data started (the ZRI Time Series data starts in November 2010). It could be said that starting at any arbitrary point will “skew” the analysis one way or another.
I pulled the data together very quickly and looked to see the large picture that it was telling. There are all sorts of ways to break it down. I’ll do more in the future
I think discussion on here has missed some of that big picture though. Places that have grown rapidly such as Roseville that has added housing units at an annual rate more than 3 times the regional average (Davis has been very close to the regional average) are also at the upper end of rent and housing costs increases. That should serve as a cautionary tale about hoping that you can try to use supply to drive affordability.
One thing to keep in mind is that, while supply/demand effects apply to housing markets, housing supply is local (in that it happens (or not) in specific locations), but housing demand is regional. Housing markets are very complex and we shouldn’t just think of one housing “market”, but multiple overlapping housing markets that are heavily influenced not only by local factors, but also by regional and national economics.
That is one reason why context is important. If Davis’s housing supply has been “only” growing at a 0.5% rate, it is a completely different thing to look at that fact on its own and draw the conclusion that “it’s the fault of the growth policies” vs. demonstrating that United States as a whole, California, the 4-county Sacramento MSA region, as well as neighboring communities such as Woodland, Dixon, and Solano County have all been growing at around that rate.
But that completely discounts the historically severe housing market collapse.
Then it’s been well within the Measure H cap of 1% through the whole time period.
Don Shor said . . . Davis housing lost the least value during the crash that immediately preceded the “period studied.” Starting your data point at 2011 really skews almost everything.
The bolded portion of Don’s comment makes sense on the surface, but when you consider it a bit less superficially, one has to wonder whether the factors that caused Davis home values to stay at a “premium” above the other communities’ before and during the housing bubble crash, also are contributing factors to those home values continuing to maintain their “premium” value after the housing crash.
If maintenance of a “premium” value does indeed make sense, then that calls into question the validity of Don’s statement that starting your data point at 2011 really skews almost everything.
I believe the conclusion Don reaches in his second sentence above is an example of a Non Sequitur logical fallacy.
Don: I’ve posted another source on this page, which shows the rate of rent increase was significantly higher in Sacramento (compared to Davis) during that same period. (That source compared the rents specifically for 1-2 bedroom apartments.)
The Zillow results apparently include the entire rental market, but confirm the same result – that the rent increase in Davis was less than that of other nearby communities, over the past few years. Your conclusion that Zillow does not use actual rent data is not supported by any evidence whatsoever. The evidence posted elsewhere on this page (several times, using several different sources) suggests that you are wrong. One of your own posts/sources showed this, as well. Again, pointed out several times to you.
Just to be clear, are you suggesting that it’s a good thing for a community (in terms of property taxes, etc.) to experience a significant market crash every few years?
FYI:
Note: “we estimate rents….”
My response to this question would not pass the moderator.
Don: Your post above does not shed any light on how Zillow estimates rents. Other posts on here show that multi-family structures are included in the estimate. For example, from my post about an hour ago, above:
The bottom line is that we don’t know exactly how Zillow estimates rents, and we’re not going to find out since its proprietary. But, if there is an “error”, it would show up in the comparison communities that Rik referenced, as well.
I don’t understand why your response to my other question “wouldn’t pass the moderator”. If we’re going to “plan via market demand”, wouldn’t it also be logical to “plan to avoid market crashes”? (Note that I’m not advocating either one.)
I’m still waiting for a response from David, regarding exactly why he doesn’t support Trackside (given his views). For that matter, do you support the current proposal? And if not, why not?
No. You won’t find that, because it is proprietary. There is not only no evidence that “multi-family structures are included in the estimate,” you will not find any information about how they come up with their mix of housing types for their estimates. It’s proprietary. The data sets are not available. We don’t know what their data sets are, we don’t know what housing mix they use, we don’t know how they adjust the data to make different markets comparable, we don’t know anything about it. It’s proprietary.
It’s suggested immediately above your comment, as well as elsewhere on this page. And, if there’s an “error”, it would show up in the comparison communities, as well.
If you don’t like Zillow, there’s plenty of other sources which show that rental increases in nearby communities and the state as a whole were equal to, or higher than the percentage increase in Davis over the past few years.
How do you and David feel about the Trackside proposal? (I ask, because opposing it seems to contradict the views that both of you otherwise put forth.) My opposition to it would not generate the same internal contradiction in views.
I bolded some text:
https://www.zillow.com/info/what-is-a-rent-zestimate/
Again, any “error” that’s present would show up in comparison communities, as well.
I’d suggest that this subject has been beat to death, and it’s time to move on. (With the possible exception of the reason that David opposes Trackside, since he specifically brought that up. Not sure what Don thinks of it, since he hasn’t responded to that question.)
Given David’s preference for dense, tall infill, why would he oppose the latest version of Trackside?
Don seems to make fun of Zillow when they say “we estimate rents….”….
I hope that Don is aware that the UC Davis survey also “estimates the rents” (of the thousands of units owned and managed by people that didn’t respond to the survey)
The majority of rents that the UC Davis survey gets are high rents from professional management firms that market premium properties to upper middle class students pushing their average higher, while the majority of rents that Zillow gets are from mom & pops posting homes for rent on Zillow that pushes their average rent lower.
I don’t understand why Don is so upset that Rik is presenting data that is just slightly lower than the date he likes knowing that an “average” rent in every city has a HUGE range from the rent in converted garages and the rent in super luxury units with attached garages and big decks.
Nope. Please don’t mischaracterize my positions.
Maybe Don can tell us what point he was trying to make when he cut and pasted:
“Note: “we estimate rents….”
Ken:
I just compiled that bulk data and put it in an article quickly. I had to idea what it would show before I did it. I drew a few big-picture preliminary conclusions. Also, one thing some people have missed is that this ZRI/ZHVI Time Series data provides the greatest comparability across different areas. The data source is one of the most relied upon in demographics and housing analysis.
Based on Matt Williams’ comment early in the discussion, I decided to look more closely at a breakdown by smaller time periods to try to see what story that would tell. I haven’t extracted data for the whole set of communities shown in the article because it is a time-intensive process, so I focused on three of the highest rent price communities in the region in addition to Davis, along with California as a whole (which the 4-county Sacramento MSA often tracks very closely to).
Results below (I can’t embed a table image, so apologies for the text formatting) for average annual growth rates in estimated median rent (calculated using compound growth rate) for specific time periods:
______________Davis Roseville Folsom Fairfield CA
1/2011-1/2018 3.00% 3.81% 3.47% 3.80% 3.67%
1/2011-1/2013 -3.71% 4.34% 3.00% 0.51% -0.60 %
1/2013-1/2015 1.00% 1.44% 2.09% 3.64% 6.34%
1/2015-1/2017 11.44% 4.87% 6.21% 7.51% 5.30%
1/2017-8/2018 2.94% 3.43% 1.15% 2.19% 2.41%
What does this data tell us?
1) For the whole period from Jan 2011 to Jan 2015, Davis actually saw a slight decrease in estimated median rents while other areas rose substantially.
2) Even well after the start of the housing recovery in 2011/201 (depending on the locality), Davis had very small rent increases compared to other cities in the region and California as a whole in the 2013-2015 time period.
3) There was a huge spike in rent rates in the region from 2015 to 2017, with the increase in Davis particularly large
4) Rent increases stabilized to much lower levels from the start of 2017 to the present across the region, including Davis
5) There is no evidence to support the oft-pushed-by-the-Davis Vanguard idea that growth management policies in Davis led to housing cost increases beyond regional rates, but there is substantial evidence that a region-wide run-up in rents from 2015-2017 was exacerbated locally by a large spike in demand from increasing UC Davis enrollment that was not being housed on-campus.
What were the rent values listed? How do they compare with the rents and rate increases from the UC survey?

(I can copy in your table if you send it to me at donshor@gmail.com)
Don,
Below are some caveats to relying on the Apartment Vacancy and Rental Rate Survey data from the UC Davis Office of Student Housing (and BAE since 2012) that you quoted. Note that I do not state that this data is “not merely wrong. It is egregiously wrong.” like you did about a well-respected data source. That’s not what professionals do. What professionals do is to examine reasons why there might be apparent discrepancies in different data sets. Looking at the statements below will get you part of the way there. Now, here’s a question: knowing what you do about the data sources and the methodologies used, what are some things that would explain the apparent discrepancies? I’ll wait for your answer…
1) Population of the survey universe: as the title declares, this data is for apartments only, not houses/duplexes/condos that are rented out.
2) Response rate. The 2013 report states that in 2012, “the Office of Student Housing mailed 177 paper surveys and received 101 responses, representing 7,798 rental units.” and “Estimates from the American Community Survey (ACS) indicate that there were approximately 11,718 multifamily housing units located on the UC Davis campus and in the City of Davis, between 2008 and 2012.” So the 2012 survey only accounted for about 66% of the multifamily housing stock. And the survey only had a 57% response rate.
3) Note that the above text refers to the UC Davis campus. It is unclear when the survey might have included UC Davis apartments and when it might have stopped (my understanding is that the 2017 survey at least only applies to properties within the city, not on campus, but I could be mistaken).
4) the survey only includes apartments with market-rate rents and excludes any subsidized units.
5) footnote on page 5 of the 2013 survey: “Average rental rates [for bed leases] were calculated based on the rental information provided by survey respondents. In cases where the respondent provided a range of prices, but no associated unit totals, BAE utilized the mid-point of the range as the assumed representative value….The figures exclude some complexes that did not provide full details on the number of units and/or bed leases, and/or lease rates.”
Looking at just one of these caveats about the Apartment Vacancy and Rental Rate Survey data from 2012:
– the response rate from the survey was only 57% (101 out of 177 surveys sent out)
– the responses received covered 7,798 rental units in apartments located in Davis and, apparently, UC Davis
– The Census states that there were 14,174 renter occupied housing units in the city of Davis two years earlier in 2010.
– We can therefore extrapolate that because it included UC Davis apartment units and that more units were built in 2 years, that the survey covered less than 50% of the total rental units in Davis.
– The type of units were not surveyed would be in non-apartment houses, duplexes, condos that made up close to half of the rental housing stock in Davis at that point (according to 2010 Census: 14,174 renter occupied housing units, but only 7,822 or 55% were in buildings with 5 or more units)
Don: Two more caveats for that data you show in the table from the BAE 2017 Apartment Vacancy and Rental Rate Survey
1) “Table 4 reports the range and weighted average of the reported rental rates for apartments leased under unit lease arrangements. Note that the survey results reported here represent properties for which respondents reported both the total number of units, by type, and the corresponding rental rate information. The results exclude survey responses with no unit type or rental rate information.” The report does not provide any indication of how many apartment complexes did not respond with the full information and were excluded from the rent price calculations.
2) The 2017 report states “that Estimates from the American Community Survey (ACS) indicate that there were approximately 11,579 multifamily housing units, on average, on the UC Davis campus and in the City of Davis between 2012 and 2016.
But, the 2012 survey stated that “Estimates from the American Community Survey (ACS) indicate that there were approximately 11,718 multifamily housing units located on the UC Davis campus and in the City of Davis, between 2008 and 2012.”
The ACS estimates show a decline in the “multifamily housing stock”! This is likely just the margin of error in the estimates, but is shows you have to be really careful to examine data sources.
Don said:
Don: please clarify your positions. After everything that you have said that is wrong regarding the ZRI Time Series data I used in the article (e.g. your false statement that it doesn’t cover apartment buildings, etc.) do you still agree with your earlier stance that “the data is not merely wrong. It is egregiously wrong and misleading as a result.”
Do you still hold the position that using this data– professionally considered a standard in the field for housing economics research–“nullifies [Rik’s] assertion regarding rental housing and calls into question the accuracy of not just this essay but all of his presentations on the Vanguard that are comprised of data and charts.”?
Now would also be a good time to summarize your educational/professional experience in demographic/housing data research and analysis, including a list of publications.