By Neil Ruud
With 40% of ballots in Yolo County yet to be processed, some of the races called in the early hours of June 6 may see a different outcome when Yolo Elections Office finishes their official count.
So before we get into the numbers game, you should know that for the rest of the article, I will be referencing primary election data from the California Secretary of State (SoS) and/or Yolo Elections Office, with a few numbers from Political Data Inc (PDI), dating back to the 1998 midterms, unless otherwise stated.
And lastly, I also want to extend my thanks to the Yolo County Elections Office for the hard work they’re doing and how patient and helpful their staff has been answering the calls and emails they’ve received from me and others.
Wasn’t the election a week ago? What’s taking so long? How have only a little over half of Yolo County Ballots been processed?
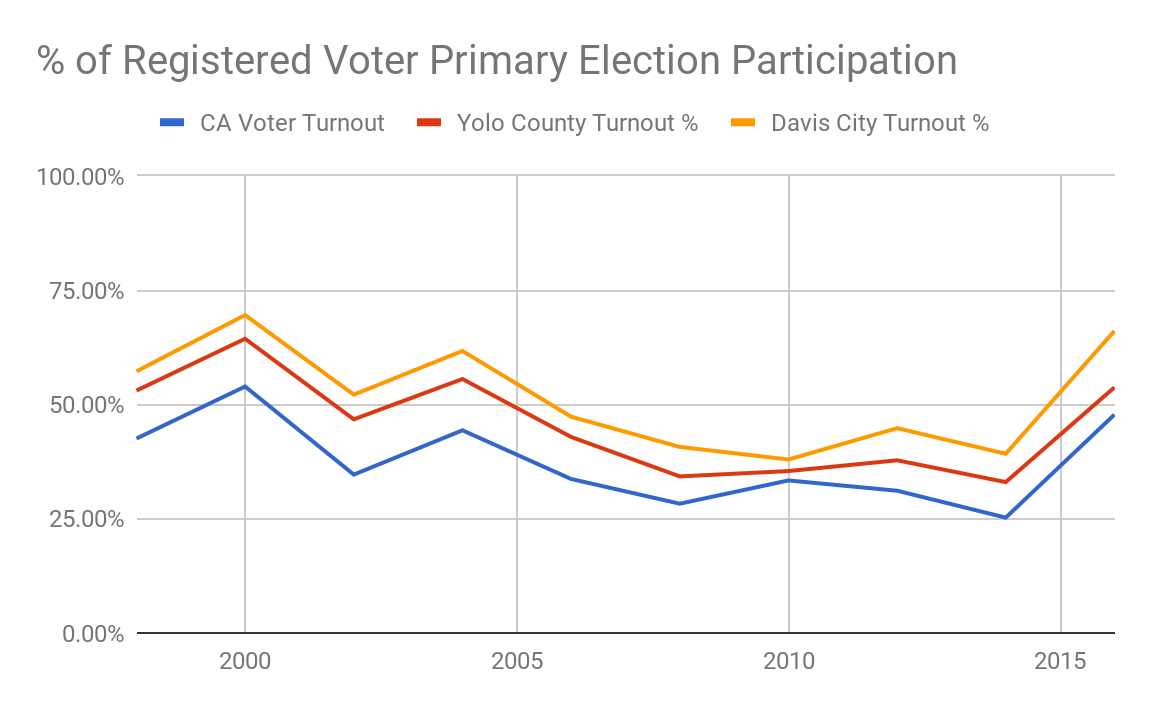
Voter turnout exceeded expectations. PDI was expecting 32% statewide turnout but it could be as high as 39% based on the number of counted and unprocessed ballots turned in and turnout in Yolo County could be as high as 42.58%. These numbers could and probably will change because it’s unlikely that 100% of ballots remaining to be processed will be counted. Additionally, not all counties have reported their most recent numbers to the SoS.

Sources: California Secretary of State, Yolo County Elections Office
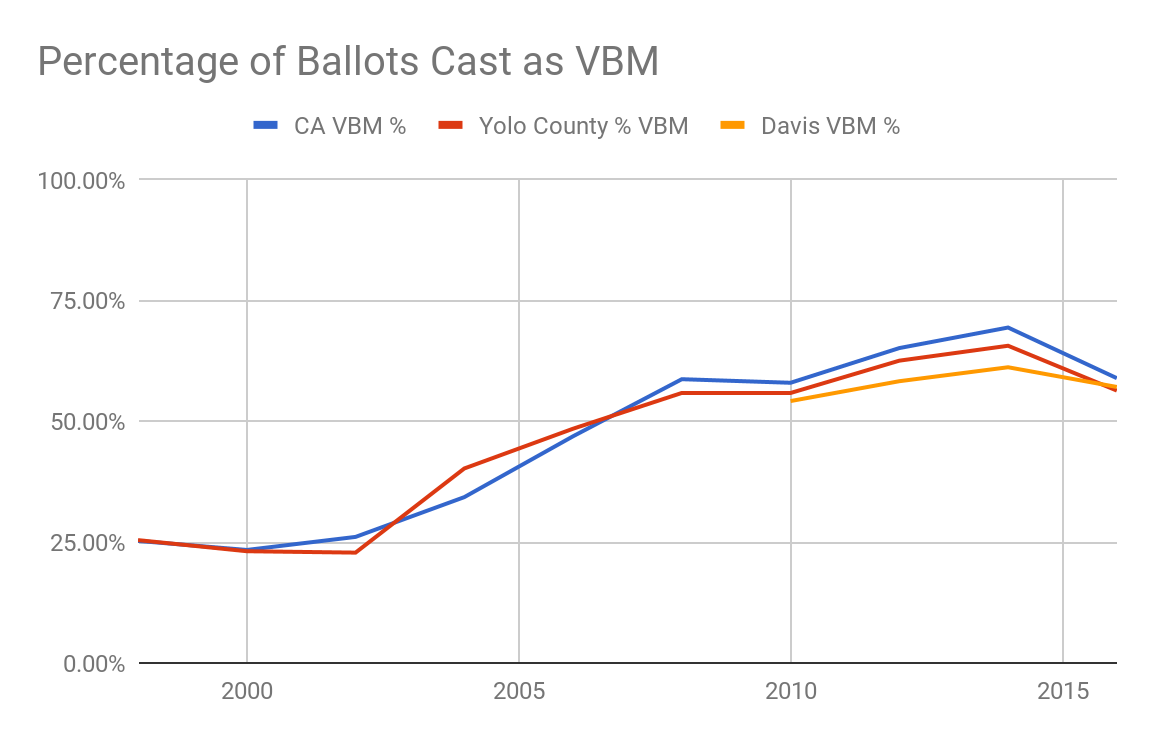
More and more voters are casting Vote-by-Mail ballots (VBM, also referred to as Absentee). VBM has nearly tripled state-wide since 1998. No, people aren’t out of town more on election day, but since voters are more likely to vote if they’re registered to VBM (or so I’ve been told), voter registration organizations encourage voters to register as VBM. Some counties, like Sacramento, are experimenting with 100% VBM registration to see if they can increase participation and cut costs simultaneously.

Sources: California Secretary of State, Yolo County Elections Office. Data is incomplete for Davis due to inconsistent online publishing of Yolo County Statement of Votes 1998-2018 but it’s import to note that Davis VBM % exceeded Yolo’s in 2016.
But, people still like voting at the polls and, it wasn’t just in your head, we had an exceptionally long ballot. A lot of people waited to vote until the last minute as we can see from the nearly 20,000 ballots yet-to-be-processed in Yolo County and 2.5 million statewide unprocessed ballots.
The problem with this is that VBM ballots take a long time to process because the voter’s signature and address have to be verified and sorted into a precinct before the multi-page ballot can be scanned. Much of this process has to be done by hand and election officials also have to confirm that the voter did not cast a ballot somewhere else.
Anecdotally, I know very few people who voted in the booth or turned in their ballots early. In a room of a dozen phonebankers on the day before election day, not a single person had voted yet despite the majority of people in the room having a VBM ballot.
So who’s vote hasn’t been counted yet?
Mine, for one. As of writing this article, my ballot has “still not been received” by the Yolo Elections Office even though I dropped it off on election day (check your VBM status on Yolo Elections Office’s site). Yolo County currently has to process 16,546 VBM Ballots, 2,181 Provisional Ballots, 113 Conditional Voter Registration Ballots, and 304 other ballots. And to be clear, it’s likely that not all unprocessed ballots will be counted since some may have erroneous information, been filled out incorrectly, or some other issue.
- VBM Ballots that were received too close to election day, on election day, or postmarked June 5 and arrived by June 8 have yet to be processed due to the lengthy, complex verification process.
- Provisional Ballots are cast by voters who “believe they are registered to vote even though their names are not on the official voter registration list at the polling place, or vote by mail but did not receive their ballot or do not have their ballot with them, and instead want to vote at a polling place.”
- Conditional Registration Provisional Ballots are a new “safety net” for voters who missed the May 21 deadline and registered.
- Other Ballots are damaged or could not be machine-read and need to be remade, and ballots diverted by optical scanners for further review.
 Source: California Secretary of State
According to Political Data Inc’s Absentee Tracker (http://www.politicaldata.com/absentee-vote-tracker/), only 5,525 out of 25,404 Davis VBM ballots had been received and processed as of 6/4, the Monday before election day. Of the 11,372 ballots mailed out to 18-39-year-old Davisites, only 932 or 8.20% had been returned. On the other hand, 60-79-year-old Davis citizens returned 43.29% of the ballots they were sent. It’s very likely that Yolo County’s unprocessed ballots contain much of the younger vote which could lead to different trends than we’ve seen so far in the ballot counting process.

Source: Political Data Inc. Absentee Ballot Tracker, Last updated by Yolo County 6/4/2018. The 80+ category also includes unknown ages.
How many of these remaining ballots are actually from Davis?
So, let’s play the educated guessing game. An average of Davis votes won’t really do the trick since there are so many different factors that could influence such an outcome. Plus, since voter turnout varies relatively drastically, an average isn’t very useful. In 2010, Davis’ turnout was only 37.90% whereas in 2000, it was nearly double that at 69.53%. An average would likely overshoot the amount of voters in a mid-term election at 51.63% which would translate to 8,916 of Yolo County’s unprocessed ballots.
A more promising option would be to look at the difference between Davis Turnout and CA Turnout (Davis Turnout % – CA Turnout %). This figure varies from +4.59% (2010, Davis’ lowest turnout) to +18.33% (2016, Davis’ Second highest turnout) and has a variance of 0.14%. This would give us a 53.51% turnout translating to 9,659 of Yolo County’s unprocessed ballots.
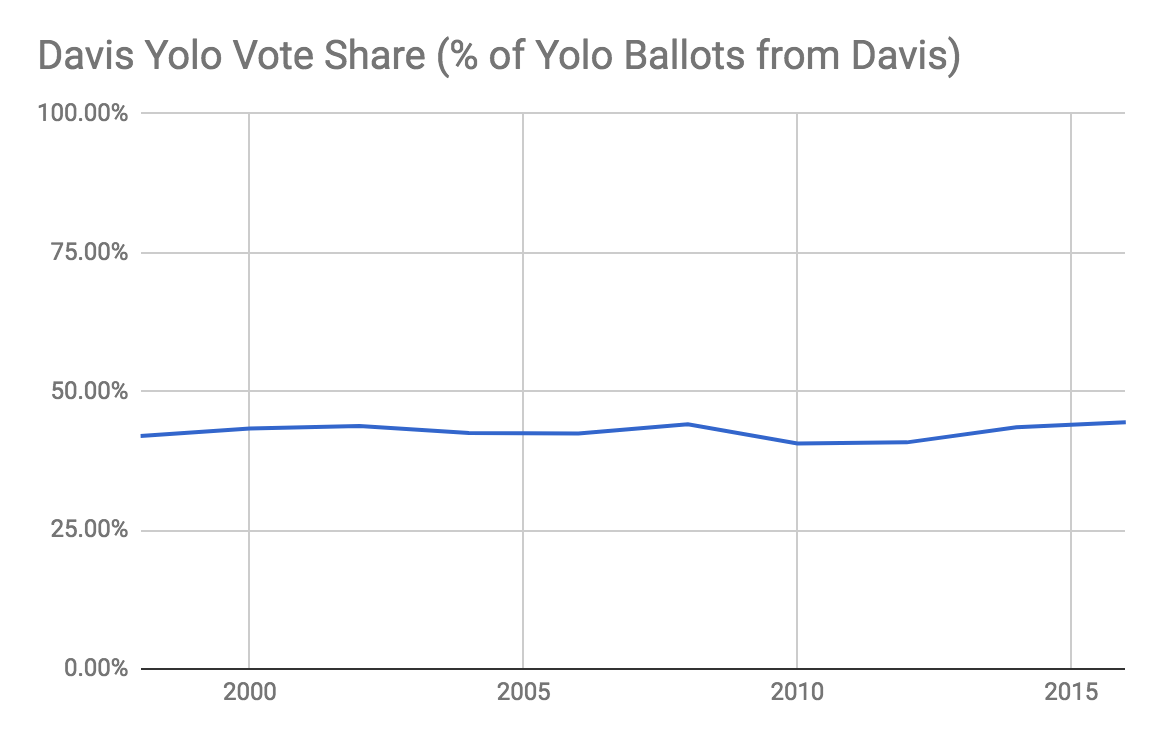
But, I’m going to use the Davis Percent of Total Yolo Votes, or what I call the “Davis Yolo Vote Share” because it is the most consistent statistic 1998 to 2016. It’s highest is 44.46% in 2016, and it’s lowest is 40.60% in 2010. With a variance of only 0.02%, it is the best candidate for predicting how many of the uncounted ballots are from Davis–especially since we know what Yolo County’s turnout is. Strangely, this gives Davis a 51.43% voter turnout percentage, pretty close to the average mentioned earlier, which would mean that approximately 8,840 of Yolo County’s unprocessed ballots are likely to hail from Davis.

Sources: California Secretary of State, Yolo County Elections Office
How could these ballots change called elections?
To generate these numbers, I looked at the total ballots in a district, the percentage of ballots casting a vote in that particular race, and then the number of uncounted ballots a candidate or measure would need to change the outcome suggested by the current vote total. This not only accounts for the remaining ballots, but how likely one of those ballots is to have a vote in a particular race.
The most-watched vote count is probably the Yolo DA’s race. In order to unseat the current DA, Dean Johansson needs more than 55.95% of the remaining vote. I think it’s very likely that Dean could catch up to the current DA since the later vote is usually younger and more liberal, but with several high-profile democratic endorsements and mixed support among Davis City Council Candidates, the outcome is uncertain. Dean has 53.71% of counted votes in Davis but volunteers on Dean’s campaign calculated that roughly 57% of in-person votes county-wide were going to Dean on Election night. Both sides are apparently feeling anxious with campaign representatives closely monitoring the ongoing canvassing efforts by Yolo County. Additionally, I’ve mostly been looking at Davis, so I don’t have as many numbers on the rest of the county. One thing is certain: we can’t be certain who our next DA will be.
Measure J’s outcome could easily change because No on J would need just more than 62.78% of remaining ballots to defeat the measure. However, my gut feeling is that Measure J will still pass and could see its margin widen due to seemingly broad support among young voters, who are likely to make up a decent portion of unprocessed ballots.
Predicting Davis City Council gets tricky since we all get two votes and there are 9 candidates in the running. So rather than throwing a bunch of scenarios at you, I’ve calculated what it would take for each candidate who’s not in the top two slots to take #2, assuming all other candidates continue to get votes at the same rate. These projections use a 1.59 vote per ballot ratio which is based on the current vote count.
- Linda Deos would need more than 40.34% of remaining ballots.
- Ezra Beeman would need more than 42.98% of remaining ballots.
- Mary Jo Bryan would need more than 47.83% of remaining ballots.
- Larry Guenther would need more than 47.89% of remaining ballots.
- Eric Gudz would need more than 53.49% of remaining ballots.
- Mark West would need more than 53.99% of remaining ballots.
- Luis Rios would need more than 56.32% of remaining ballots.
None of these outcomes are totally unreasonable, if only unlikely. It’s possible (and somewhat likely) that those several thousand unprocessed ballots have a completely different demographic makeup than counted ballots. If that’s the case, we could see wildly different results from individual candidate popularity to votes per ballot. It’s also likely that if one of the above candidates started to get a larger portion of the votes on uncounted ballots, Dan Carson or Gloria Partida would see their share of the uncounted ballots vote drop to a larger degree than the others, something for which this model does not account. With so many variables in play, it’s hard to say exactly what will happen but it’s definitely premature to declare a pro tem, let alone the race.
Measure I faces a much steeper climb to reach the two-thirds majority required of special taxes placed on the ballot by legislative bodies, needing more than 79.65% of remaining ballots. Only 93.95% of Davis voters felt like voting one way or the other. But 79.65% isn’t as impossible as it may seem on the surface since it’s very likely the unprocessed ballots are more liberal than those already counted and Measure H currently has 72.5% of counted ballots. It is unlikely to pass, but not impossible.
So, with only 60% of the Yolo County vote processed, it may have been a bit early to call some races. For me, the most interesting question remaining: how many young voters returned their ballots? Could that increase Davis turnout even further? Davis picked up an additional 3,500 registered voters since the last primary, about a thousand more than forecasted based on previous trends–did they show up?

Source: Political Data Inc.
Neil Ruud is a political activist and consultant.


NR, I almost didn’t read this, but you took a dry subject matter and made it interesting and easily understandable, a rare ability. A big thank you from I and the entire Pancakes & Politics team, such as it is.
Thank you!
Agree, but the “easily understandable” part was at the cost of accuracy… particularly to VMB’s and reasons (and sometimes, excuses) for provisional ballots… we had 126 at our precinct…
HP, not being clear on what was not accurate . . .
Good call, Alan… I apparently mixed up some statements in this article with some I read in the Bee… my main “issue” was distinctions between VBM’s and “provisionals”… the source questioned if they even should be counted, reflecting…
Neil correctly combined them as “uncounted”, and accurately pointed out the definition of “provisionals”… of the 126 “provisionals” we processed, nearly all were apparently due to their VBM ballots not being received (uclear if that was an “elections” problem, or USPS), misplaced (“dog ate my ballot”), or no record in the voter list of streets in the Cannery (streets didn’t ‘exist’, but I knew they did)… one was funny… (guy’s Dad used his son’s VBM as a “sample ballot”!)… we had one voter who I thought was being untruthful, but so noted, as poll workers get to write comments, for the Co. folk to sort out.
Bottom line, Neil’s account is ~ 99.95% accurate… I misspoke, confusing (conflating?) what I had read in another source… think I’m the 0.1% here who can own up to an error, and/or apologize… I hereby do both… wasn’t intentional, but stuff happens…
Best.
So . . . bottom line . . . Neal still rocks?!!!!
Your opinion as to “rocks”… I say “nihil obstat”, for sure, on this subject. and thank him for objective info…
Some want us to “celebrate” all their views/values… I respectfully decline. I do respect factual information. And those who present it.. A 1% thing, I fear…
And, is it “Neil” or “Neal”?
My bad… spelling is off-limits for comments…
Ditto for the thanks Neil!
Any idea of progress in the counting? Will they give updates or just at end?
They’re hoping to publish an update at the end of the week but they’re not guaranteeing anything. Personally, I’d almost prefer they just finish the counting before another update. Typically, it takes about two weeks but with the unexpectedly high turnout and unprecedented day-of VBM it might take a little longer.
I agree… initial count, and canvassed results… no “teasers” in between… the only count that counts, is the canvassed results…
This isn’t a sports game with another segment to score?
Not to me, but as we all know, I have no credibility…
As Ike and Tina might have sung, “…trolling on the river”…
I was an inspector at a Davis precinct that’s part of Don Saylor’s district — but we had voters from the eastern – Provenza – part of Davis who voted provisionally, using the only ballots we had, which of course had Saylor up for re-election (uncontested). What happens to these provisional ballots? Does it matter if people voted for Saylor since they weren’t actually allowed to, i.e. would that invalidate the ballot?
I’m not sure. That would be a question for the elections office. My instinct says that those are valid assuming everything else checks out.