

Definitions, Measures, and Data for Davis and Yolo County
by Robb Davis
Michael Bisch, Executive Director of the Yolo Food Bank has provided valuable information on the state of food insecurity among Davis and Yolo County residents here, here, and here. Still, very few people know exactly what food insecurity means, how it is measured, and what it correlates with. Is food insecurity the same as “hunger”? What, if any, is the relationship between food insecurity and poverty? How do we understand the meaning of statements like “twenty-five percent of children in Davis schools qualify for free or reduced lunches”? And what does having a large university in our City mean about estimating levels of food insecurity and poverty?
The following is an attempt to lay out the definitions of these terms, the sources of the data and the overall implication for understanding food insecurity in our city and county. We will look specifically at the National School Lunch program eligibility criteria and rates for Davis; the Yolo County and City poverty levels derived from the American Community Survey (Census Bureau); and estimates of food insecurity provided by the organization Feeding America, the University of California and UC Davis (the latter two for students only).
Definitions
Poverty
In the US, the Census Bureau uses a set of money income thresholds that vary by family size and composition to determine who is in poverty. The thresholds are based on a method developed in the early 1960’s by Mollie Orshansky of the Social Security Administration.
The thresholds she defined were based on what families needed at the time to purchase an “economy food plan” from Department of Agriculture studies and used before tax income since that was the data that was available. No other adjustments to income were made such as taxes paid or the value of government transfer or income support programs.
She assumed that families spent about one third of their income on food but did not derive calculations for expenditures on non-food items. She simply multiplied the cost of the economy food plan by three and then adjusted it for different household sizes (and a few other factors). She expressed the opinion that the resulting thresholds would yield a conservative underestimate of poverty. (see Fisher (1992) for a brief summary of her method.)
Despite modest changes over the years, the Orshansky method still underlies the calculations of the official poverty threshold.
Given the limitations of the official poverty measure, the Census Bureau has developed an alternative “Supplemental Poverty Measure” (SPM) that includes additional information on both taxes and government transfers. The Orshansky’s method is 100% food-purchase based and does not vary across the US: the same thresholds are used everywhere. The SPM, on the other hand has different thresholds by state and accounts for non-food purchases—including housing—to estimate poverty. This Infographic provides a useful snapshot of the differences between the official poverty measure and the SPM. Note these two maps from the Infographic:
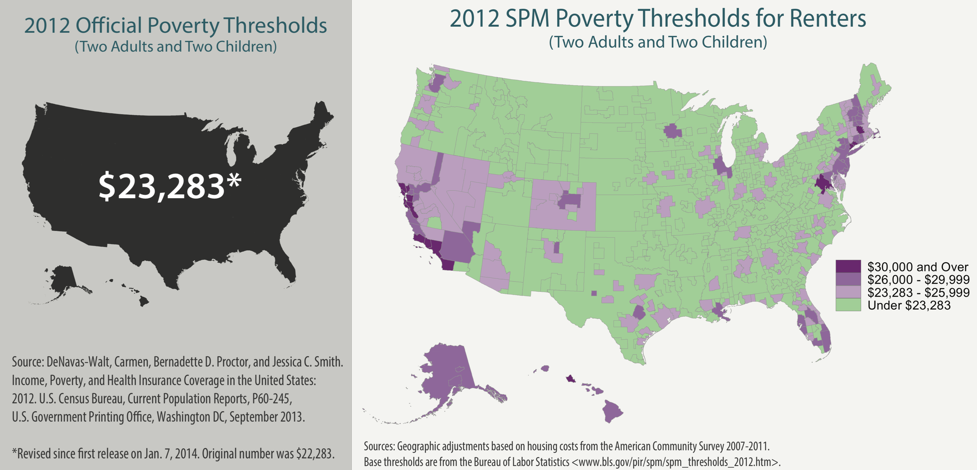
Using the Orshansky model 13.4% of Californians are in poverty. Using the SPM about 19% are in poverty. Housing costs are thought to be a main explanation for the difference.
The Census Bureau uses the annual American Community Survey (ACS), a large sample of US households, to collect information on and estimate the population parameter of percent living in poverty at county and city levels. The SPM data produces only state level parameter estimates. We will examine data from each below.
Free and Reduced-Price Meals
When you see or hear about data on “free and reduced prices meals/lunches” the data refers to the National School Lunch Program (NSLP). The NLSP is a federally assisted meal program that has been in operation since the immediate post World War II period.
The Food and Nutrition Service (FNS) of the United States Department of Agriculture (USDA) administers the Program at the Federal level. In California, the NSLP is administered by the state Department of Education.
The goal of the program is to provide free and reduced-price lunches that are nutritionally balanced—with the nutritional composition determined by the FNS/USDA.
Qualification for the NLSP is based on the official poverty measure and the USDA annually produces income threshold tables for different household sizes to determine which students are eligible. Reduced price lunches are eligible to those at 185% of the federal poverty threshold and free meals for those at 130% of the federal poverty threshold. Reduced prices lunches cannot cost more than 40 cents per meal. Children in households that receive Supplemental Nutrition Assistance Program (SNAP) benefits—known as CalFresh in California, Food Distribution Program on Indian Reservations (FDPIR) benefits, or children who are recipients of Temporary Assistance for Needy Families—known as CalWORKs in California are automatically eligible for free meal benefits. (Different threshold tables are produced for Hawaii and Alaska). (See the NLSP fact sheet for a summary).
Food Security
Unlike the Census’ official poverty measure, the SPM, or the NLSP qualification criteria, the definition and measurement of food security are not standardized. A very good source of information on the concept of food security is the comprehensive literature review by Jones et. al. (2013). The review states that
(t)he most commonly used definition of food security is based on the definition from the 1996 World Food Summit: Food security, at the individual, household, national, regional and global levels [is achieved] when all people, at all times, have physical and economic access to sufficient, safe and nutritious food to meet their dietary needs and food preferences for an active and healthy life.
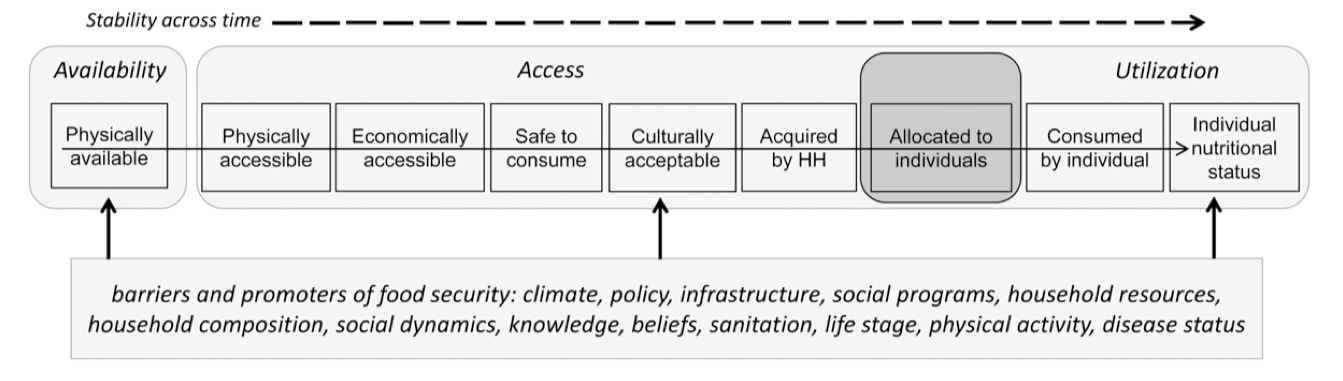
The authors helpfully distinguish often-interchanged concepts such as undernutrition, hunger, and nutrition insecurity, defining each in its turn. The following diagram is adapted from their article and from prior work by Benson (2004)—with my own additions—and helps distinguish these terms.

Most helpfully, for our purposes, they discuss in some detail the three key elements of food security—availability, access, and utilization, with a fourth, the idea of temporal changes in any of the three, to provide a richer understanding of what food security is.
The diagram below, drawn from the paper illustrates the important role of access—both physical and economic—to assuring food security. Drawing on the foundational work of Amartya Sen (1981) the authors conclude that, contrary to conventional wisdom, food availability (physical presence of food in a nation or region) is rarely the deciding factor in food security. Rather, people’s ability to obtain or access the food that is available is the key. Further, intrahousehold dynamics, and access to other health promoting behaviors and services are important factors in how accessed food is actually utilized by individuals.
The authors concur that examining food security at the household level makes most sense, even if it hides certain intrahousehold factors that may change an individual household member’s ability to utilize the food in the household.
After laying out the key definitions the authors review a variety of ways that food security is measured or assessed around the world. Some of these are based on national level food balance sheets or more complex ways of assessing macro-level “security” and I will not discuss them further.
The tools that have gained the most attention locally—via the UC Davis food security analysis, that I will discuss in more detail below—are largely derived from the Household Food Security Survey Module (HFSSM) that was developed based on research initiated by Present Reagan’s Task Force on Food Assistance in the mid-1980s.
The HFSSM, and a variety of tools that have come from it, uses an 18-question survey module that asks respondents their experience in four domains:
1) anxiety about household food supplies;
2) perceptions that the quality or quantity of accessible food is not adequate;
3) reduced adult food intake; and
4) reduced food intake by children
Based on responses, households are classified as either food security, having low food security, or very low food security (see the publication Household Food Security in the United States in 2017 for details on how these classifications are made). More streamlined questionnaires with fewer questions have been developed (and validated) to more rapidly assess food security.
The table below provides the current questionnaire used in the Current Population Survey (CPS).[i] Note the additional questions used in the case of households in which children are or are not present. The bolded questions are used in a short-form of this survey, which has been validated (see Blumberg et al (1999)) as a reasonable means to more rapidly assess food security. Questions 1-4 and 6 and 7 were used in recent University of California and UC Davis assessments of food security among students discussed below.

The publication Household Food Security in the United States in 2017 referenced above provides extensive information on food security in the United States and discusses, among other things, its chronicity versus its transitory nature in subgroups. Space does not permit a full analysis of the results and caveats here but the paper is highly recommended.
As we will see below, these scales have been shown to operate as relatively reasonable proxies for poverty in a variety of studies around the world. Conversely, poverty measures are often used to derive local-level estimates of food (in)security.
Data for Davis and Yolo County
With these definitions in mind, we can now turn to examine data for Davis and Yolo County
Poverty
Data on Davis and Yolo County is accessed at https://factfinder.census.gov/faces/nav/jsf/pages/index.xhtml.
Note that data presented in what follows are from the American Community Survey using “5- year estimates”—The 5-year estimates from the ACS are “period” estimates that represent data collected over a period of time. The primary advantage of using multiyear estimates is the increased statistical reliability of the data for less populated areas and small population subgroups. The ACS also has extensive information on the precision of estimates (margins of error) that I will not get into here. Suffice to say that data for subgroups available for the City or County are less precise because of sample sizes.
As a reminder, the official poverty rate for California as a state is 13.4% but the SPM estimate puts the rate at 19.0%. There is general agreement that the official poverty rate underestimates poverty in California for reasons discussed previously.
In the next section, we will examine limitations of these official estimates as they concern university students and suggest some possible adjustments.
Free and Reduced-Price Meals
Data on the proportion of students in Davis and Yolo County who are eligible for free and reduced-price meals is accessed at https://www.cde.ca.gov/ds/sd/sd/filessp.asp.
This data comes from the California Longitudinal Pupil Achievement Data System , which is longitudinal data system used to maintain individual-level data including student demographics, course data, discipline, assessments, staff assignments, and other data for state and federal reporting.
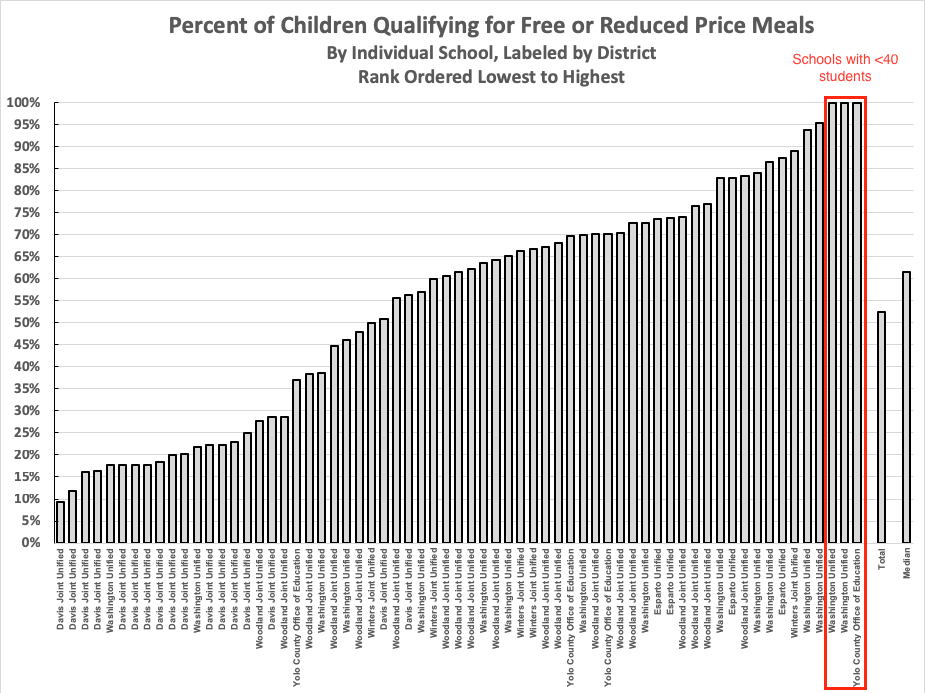
The following presents the data in tabular and graphical form—the latter by Yolo County School District. Note that the lowest eligibility percentage is from Cesar Chavez Elementary School in the Davis Joint Unified School District. The highest eligibility percentage for schools with over 40 enrolled is from the Westfield Village Elementary School in the Washington Unified School District in West Sacramento.

Food Insecurity
As noted, measuring food security is more challenging and local-level estimates are not directly available from the data collected. The USDA’s Household Food Security in the United States in 2017 estimates that 11.2% of Californians are food insecure with 4.1% experiencing very low food security. The margins of error lead to the conclusion that food insecurity in California, as a state, is lower than the national estimate (significant at 90% confidence level).
The non-profit Feeding America (see https://www.feedingamerica.org/about-us) publishes online maps with estimates of food insecurity for each county in the US. Their publication: Map the Meal Gap 2018: A Report on County and Congressional District Food Insecurity and County Food Cost in the United States in 2016, lays out the full methodology they use model county estimates from national data on food security and, as we discuss briefly below, it uses income, employment and other demographic factors to estimate food insecurity for each county.
According to Feeding America, approximately 14% of Yolo County residents are food insecure with 79% of those falling below 200% of the official poverty threshold. This means that over 29,000 Yolo County residents are food insecure according to their model. See http://map.feedingamerica.org/county/2016/overall/california/county/yolo for these estimates.
(Note that they use a higher population figure than the ACS and thus percentages yield different estimates of numbers. Keep in mind that the ACS numbers we used were 5-year estimates, not accounting for population growth as the Feeding America data does.)
In addition to these estimates, the University of California, Davis produced its own report of food insecurity among students based on the work of the Chancellor’s Task Force on Student Food Security. As part of the Task Force work, which looked not just at food insecurity but also University programs addressing it and recommendations for other programs that might help, a survey went out to over 7,000 randomly selected students with 376 responses.
The survey used a reduced form of the Household Food Security Survey Module (HFSSM) discussed above and found that 44.1% of students experience low or very low food security and that 22.3% experience very low food security. Assuming responses were random, the 90% confidence level for these estimates is about +/- 4%.
The UC Davis survey has similar findings as a broader University of California-wide survey using the same method from 2015. That survey, cited in the Task Force report, found that 42% of students, university-wide have low or very low food security.
Poverty Measures—The Effect of Large University-Student Populations on Estimates
The official definition of poverty in the ACS does not easily tease out the fact that college students may be classified as “poor” because they are not working and have no visible “income.” As a result, the Census Bureau has proposed a simple method to completely remove them from local poverty calculations. Students living in dorms are currently not countered in the official poverty count but those living in the community are captured in the ACS.
As demographers at the University of Virginia’s Demographic’s Research Group note in a recent Census Brief (2016):
Most college students report very low incomes, putting them below their respective poverty thresholds and—especially in cases of large off-campus student populations—raising the rate of poverty in the towns where they live. Yet, intuitively, we recognize that college or graduate student “poverty” means something different than poverty among the unemployed, families with children, or the persistently needy.
In most cases, the removal of students does not change the estimates of the proportion of the population living in poverty, but as the authors argue, in University towns such as Davis, with a large student population living within the city, the presence of students who may be only transitorily poor can lead to confusion about the true level of persistent poverty and cloud decision making about the best ways to deal with it. Please note that students living in dorms are NOT counted in the ACS methodology so the data covers students living in the community.
As noted, the methodology is straightforward and involves simply removing all graduate, professional, and undergraduate students from poverty calculations. The following screenshot from the ACS “FactFinder” data source shows the way data for Davis is presented and what is pulled out in the calculation of non-student poverty rates.

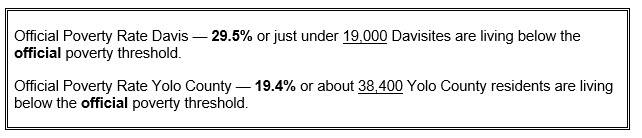
Applying this methodology to Davis and Yolo County yields the following results. The Davis non-university-student poverty rate is 9.35%. This implies that about 4000 Davis residents, excluding university students, live in poverty. For the county (including Davis), the non-university poverty rate is 12.3% or just under 20,000 people in poverty.
The problem with the Census Bureau approach is that is simply removes all students from calculations. This, despite the fact, that some students ARE poor, notwithstanding family or other support. As we demonstrate briefly below, food insecurity does stand as a proxy for poverty (and vice versa).
With this general principle in mind, if we add back in the university population and assume in Davis and county-wide that 44% of students are poor as estimated by the food security survey—low and very low food security (rather than the official poverty rate), then the Davis poverty rate is 21.5% or just under 14,000 living in poverty. For the county (including Davis) the adjusted rate is 18% or 35,581 in poverty.
While these adjustments may be considered too liberal, they do provide a means to add in truly poor students who, for whatever reason, are finding it difficult to provide for their basic food needs. If we assume that only students who have very low food security are truly poor the poverty rates for both the City and the County are about 14%—with nearly 9,000 people in the City and 28,000 people in the County (including Davis) living in poverty.
To summarize:
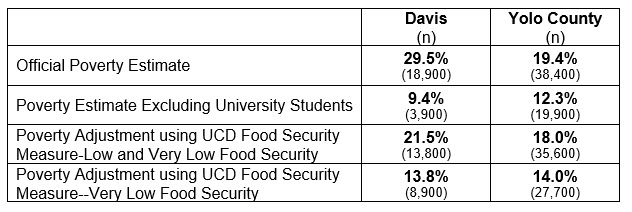
Again, this approach does mix two sources and two distinct concepts: poverty and food security. But as we have seen from the SPM estimates for California—and given Yolo County’s relatively high cost of living, these rates would seem to be realistic.
Food insecurity are inextricably linked. So, we might derive a more robust estimate of poverty in Davis by integrating estimates of food insecurity into the poverty measurement.
Food Security and Poverty: Connections
It is interesting that in some instances, food insecurity measures are used as a proxy for poverty and in others poverty is used to model food insecurity at the local level. This has to do, almost entirely, with the ease of measuring income poverty versus measuring food insecurity.
In many economically poorer nations around the world, collecting accurate data on income poverty is difficult because of the high percent of the population that works in the informal sector, outside wage labor, or in situations in which income taxes are collected sporadically or not at all.
In these environments, community-based surveys can rapidly collect data on household food insecurity. Indeed, in environments in which food insecurity is widespread, data collection may focus more specifically on hunger via household hunger scores.
Davis-based Freedom from Hunger (FFH—now Grameen—full disclosure, I worked for Freedom from Hunger 1999-2005 and 2007-2008) has been a pioneer in assessing household food security in resource-poor environments and assessing its relationship to poverty. Freedom from Hunger has also developed tools to assess actual hunger scores in environments in which many or most households are food insecure.
FFH adopted a very simple food security scale based on four options:
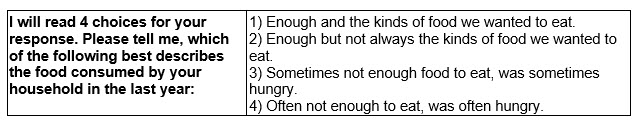
Scoring:
Answer 1 = Food Secure
Answer 2 = Food insecure without hunger
Answer 3 = Food insecure with moderate hunger
Answer 4 = Food insecure with severe hunger
They conclude in an unpublished document
Grameen research has shown that this measure is correlated to dietary diversity, poverty, and women’s autonomy, resilience, among others. This gives Grameen confidence that despite the simplicity of the question, it can be a useful measure for identifying food insecure households due to these correlations with anticipated outcomes.
The Household Hunger Survey gets more to the point about hunger with questions such as: In the last four weeks, did it happen that there was no food to eat of any kind in your house, because of lack of resources to get food? This kind of survey is necessary in areas of widespread food insecurity to distinguish cases of extreme food insecurity.
FFH-supported research has demonstrated that a simple household food security survey can stand as a proxy for poverty. As a paper by Melgar-Quiñonez summarizes:
(H)ousehold food security may serve as a high-quality proxy for expenditure as a predictor of household “income poverty”.
In the USA, in contrast to FFH’s work, poverty measures become one element in modeling that helps estimate county food security statistics across the US. In a methodological brief on how they estimate county-level food insecurity based on national-level data, Feeding America notes:
The food-insecurity model demonstrates the relationship between food insecurity and several indicators including unemployment and poverty.
As expected, after controlling for other factors, higher unemployment and poverty rates are associated with higher rates of food insecurity. A one percentage-point increase in the unemployment rate leads to a 0.5 percentage-point increase in the overall food-insecurity rate, while a one percentage-point increase in poverty leads to a 0.26 percentage-point increase in food insecurity.
And the Household Food Security in the United States in 2017, already referenced, notes the following:
Differences in food security across demographic and geographic groups reflect, in part, differences in income across those groups; though no adjustment is made for income in the statistics presented in this report, food insecurity was strongly associated with income. For example, 36.8 percent of households with annual incomes below the official poverty line (household income-to-poverty ratio under 1.00) were food insecure, compared with 5.8 percent of those with incomes at or above 185 percent of the poverty line (emphasis added).
Food security and poverty mirror each other. Poor people are food insecure. Food insecure people are poor. When decisions about expenditures need to be made under severe constraints, food is the most “fungible” of purchases. Rent is required. Gas for the car to get to work cannot be “scrimped” on. Not so with food. When poor people face spending choices, food is foregone for the sake of survival. This seems to be true in Africa and America.
When you read that people are poor, keep in mind that it has real effects on their ability to obtain nutritious food in quantities that most of us take for granted. And when you read that people have low or very low food security, remember that it means that they face choices that most of us do not have to make.
Tens of thousands of our neighbors in Yolo County live in poverty—with food insecurity a part of many of their lives.
Robb Davis is the former Mayor of Davis. This piece was first published at robbdavis.blog—write Robb at robbathome@gmail.com with questions, corrections, or comments.
References and Sources Cited
American Community Survey (Census Bureau) “FactFinder” page for data on the ACS: https://factfinder.census.gov/faces/nav/jsf/pages/index.xhtml
Benson, Todd (2004) Africa’s Food and Nutrition Security Situation: Where Are We and How Did We Get Here? International Food Policy Research Institute, 2020 Discussion Paper 37. Accessed at http://ageconsearch.umn.edu/bitstream/42272/2/2020dp37.pdf
Bisch, Micheal (2018):
https://davisvanguard.org/2018/12/guest-commentary-hunger-davis/
https://davisvanguard.org/2018/11/thanksgiving-for-everyone/
https://davisvanguard.org/2018/12/food-insecurity-councilmembers-inspiring-story/
Blumberg, Stephen J., Karil Bialostosky, William L. Hamilton, and Ronette R. Briefel, DrPH, RD (1999) “The Effectiveness of a Short Form of the Household Food Security Scale” American Journal of Public Health. 89:1231-1234.
https://www.ncbi.nlm.nih.gov/pmc/articles/PMC1508674/pdf/amjph00008-0087.pdf
California Department of Education, Student Poverty FRPM Data https://www.cde.ca.gov/ds/sd/sd/filessp.asp
Coleman-Jensen, Alisha, Matthew P. Rabbitt, Christian A. Gregory, and Anita Singh. 2018. Household Food Security in the United States in 2017, ERR-256, U.S. Department of Agriculture, Economic Research Service
https://www.ers.usda.gov/webdocs/publications/90023/err-256.pdf?v=0
Fact Sheet: Differences Between the American Community Survey (ACS) and the Annual Social and Economic Supplement to the Current Population Survey (CPS ASEC) https://www.census.gov/topics/income-poverty/poverty/guidance/data-sources/acs-vs-cps.html
Fact Sheet National School Lunch Program: https://fns-prod.azureedge.net/sites/default/files/cn/NSLPFactSheet.pdf
Fisher, Gordon M (1992) “The Development and History of the Poverty Thresholds” Social Security Bulletin, Vol. 55, No. 4, Winter pp. 3-14
https://www.ssa.gov/history/fisheronpoverty.html
Grameen Foundation (2018) Measuring Food Insecurity.
https://robbdavis.files.wordpress.com/2018/12/Grameen-Food-Security-Measures-1.pdf
Jones, Andrew D., Francis M. Ngure, Gretel Pelto and Sera L. Young “What Are We Assessing When We Measure Food Security? A Compendium and Review of Current Metrics” Advances in Nutrition 4:5, 1 September 2013, Pages 481–505
https://academic.oup.com/advances/article/4/5/481/4557948
Map the Meal Gap 2018: A Report on County and Congressional District Food Insecurity and County Food Cost in the United States in 2016 (2018)
https://www.feedingamerica.org/sites/default/files/research/map-the-meal-gap/2016/2016-map-the-meal-gap-full.pdf
Measuring America: How the U.S. Census Bureau Measures Poverty (Infographic accessed December 2018)
https://www.census.gov/library/visualizations/2017/demo/poverty_measure-how.html
Melgar-Quiñonez, Hugo (2004) Testing Food-Security Scales for Low-Cost Poverty Assessment Research Report. Freedom from Hunger
https://robbdavis.files.wordpress.com/2018/12/Testing-Food-Security-Scales-for-Low-Cost-Poverty-Assessment.pdf
Promoting Food Security for UC Davis StudentsReport and Recommendations of the Chancellor’s Task Force on Student Food Security (2018)
https://leadership.ucdavis.edu/sites/g/files/dgvnsk1166/files/files/page/Food%20Security%20Task%20Force%20Report%202018-07-05.pdf
Room, Annie and Luke Juday (2016) Poverty and postsecondary students in college towns. Census Brief, Demographics Research Group, University of VA. https://demographics.coopercenter.org/sites/demographics/files/CenusBrief_Students-in-Poverty%20%281%29.pdf (see also: http://statchatva.org/2016/03/07/how-to-modify-poverty-calculations-for-college-towns/)
Sen, Amartya (1981) Poverty and famines: an essay on entitlement and deprivation. New York: Oxford University Press. Accessed at
https://www.prismaweb.org/nl/wp-content/uploads/2017/06/Poverty-and-famines%E2%94%82Amartya-Sen%E2%94%821981.pdf)
[i] The ACS uses an up-to-date sampling frame (the Census Bureau’s Master Address File updated by using the U.S. Postal Service’s Delivery Sequence File and targeted address canvassing). Prior to 2014, the CPS ASEC used sampling frames derived once a decade from the Decennial Census (updated with new construction). Beginning in 2014, the CPS sample is derived annually from the Master Address File with updates from the United States Postal Service (USPS). Overall coverage for the ACS and the CPS ASEC appear to be comparable.
The ACS data collection methodology is substantially different from the CPS ASEC, as the CPS ASEC is conducted by interviewers via Computer Assisted Telephone Interviewing (CATI) or Computer Assisted Phone Interviewing (CAPI). In contrast, the ACS uses a self-response mail-out/mail-back questionnaire with an internet response option, followed by CATI or CAPI follow-up conducted by interviewers. Additionally, the ACS, like the decennial long form, is mandatory, and therefore response at the unit and item level is higher in the ACS than the CPS ASEC
(from: https://www.census.gov/topics/income-poverty/poverty/guidance/data-sources/acs-vs-cps.html)

Great article. I plan to go back and explore the supplementary material.