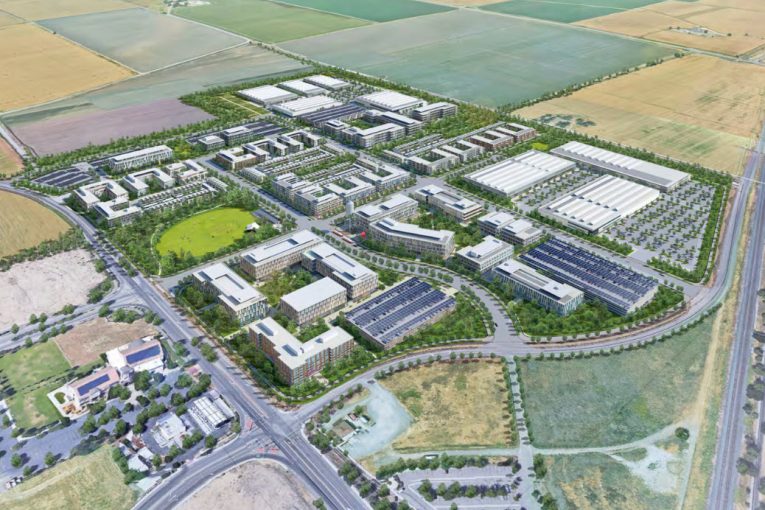

At the last Finance and Budget Commission hearing, they examined the then-Aggie Research Campus, since renamed the Davis Innovation and Sustainability Campus. A subcommittee was assigned to look at the Economic & Planning Systems model and they ask a number of critical questions about the findings and the sensitivity.
EPS came up with a number—$5.4 million—as its estimate of the fiscal impact. In 2015, the number was much lower—just over $2.2 million.
The subcommittee asked an important question: “The 2015 fiscal Impact analysis by EPS of the then ‘MRIC’ revealed a less favorable fiscal picture than the ARC 2020 analysis. We recognize that there  are some differences in the projects, but could EPS provide a financial reconciliation of the difference between the two?”
That is the right question and it was one of the first things we looked at. There are some differences in how the two projects are estimated, but when we looked at the numbers, we found most of the differences were due to structural changes—the passage of the sales tax was big, the change in how ERAF (Educational Revenue Augmentation Fund) was factored, the addition of TOT (transient occupancy tax), etc.
This piece is primarily going to focus on two points here. One of them is a question from the subcommittee, and the other a question that has been floating in the community.
The subcommittee writes: “We would like to ask EPS to review the data around number of City of Davis employees as it appears that the number is inflated by UC Davis employees working on campus which is outside the city limits. If this number is inflated then we would ask for the model to be re-run with a more accurate persons served calculation…”
This is a good point because, as we started to look at some of the analysis last week, we discovered that the numbers are all over the map in terms of employment figures.
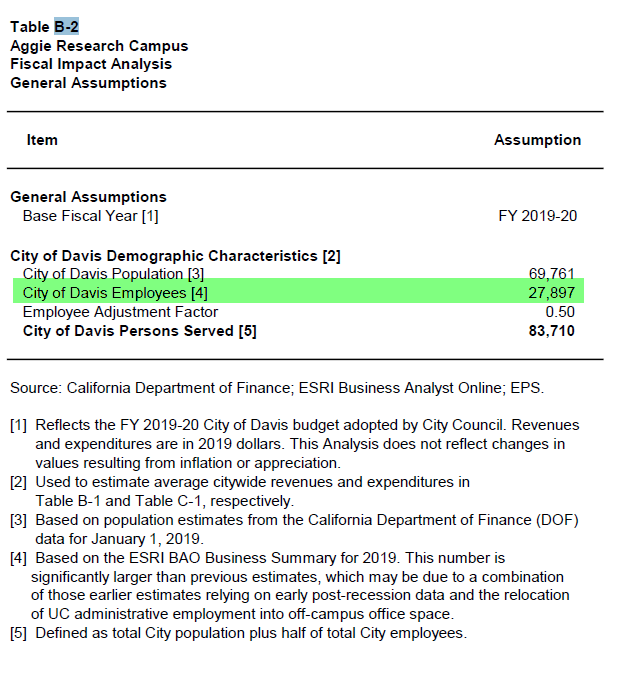
This is Table B-2 from the Aggie Research Campus, where they estimate the number of City of Davis Employees as 27,897.
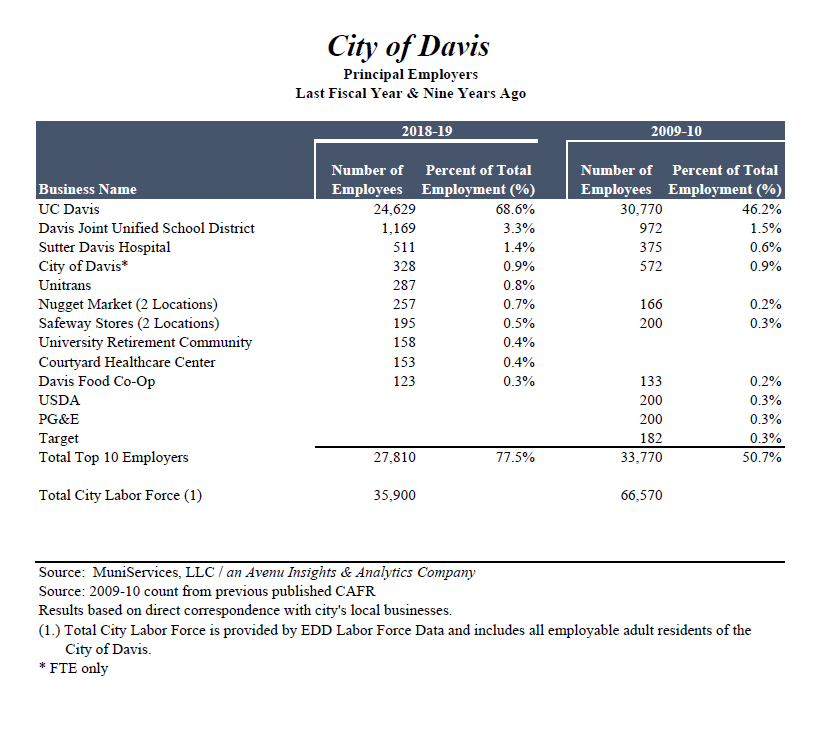
This is the most recent CAFR (Comprehensive Annual Finance Report) from the city. They have a different number—35,900 city employees, ignoring the figure from 2009-10 which the city has already acknowledged is an error, that 66,570 was the total population of the city.

This is the 2018 Existing Conditions Report.
Remembering that these are coming from different years and somewhat different sources, which wouldn’t seem to account for the variance here.
But as we can see from the CAFR, it places the number of employees at 24,629. But we know from other data that is probably the combined number of people working at the Davis campus and at the Medical Center. The number of people working at the Davis campus is just over 13,000 while about 11,000 or so are working in Sacramento.
I have a question into the city trying to sort some of this out, and it is not clear how much this kind of confusion actually matters in terms of the fiscal analysis, but if we want to understand the jobs picture, we should know how many people from Davis work in Davis itself, or at UC Davis—Davis campus and at the Medical Center.
Point number two.
I happen to believe that the EPS calculations are still too low. The figure of $5.4 million, given the size and scope of the project, is probably a low figure. But for the most part I would prefer a conservative estimate, as the numbers are more defensible.
One of the points that has been raised in opposition to those figures, however, is that the rental estimates are too high. That was in a comment last week and I have seen it elsewhere.
The critics have argued, “The EPS report assumes grossly inflated office rents/leases which is far in excess of regional average office rent/lease values…”
One person cites a regional rental average of about $2.15 per square foot. If you look at EPS they estimate for ARC (remember, pre-DISC days), that for flex space it will average $2.33 per square and for office space it will be $2.92 per square foot.
As we will see in a moment, the biggest problem here is that 2.15 to 2.92 is not an apples to apples comparison.

You can probably accuse EPS of looking at a rather limited set of data to come up with these figures, but if $2.15 is indeed the regional average, then their metrics are reasonable.
The key factor here that explains the difference between $2.33 and $2.92 is the lease type. EPS argues that office space in the project will “align with Class A properties” while flex and R&D space “would likely be similar to some of the Class B office spaces…”
The key difference—the Class A office “is generally leased on a Full Service Gross basis” which means the taxes, utilities, and maintenance are included in the rent. That they estimate to come to 30 percent of the rental income, which accounts pretty much for the difference. Whereas Flex and R&D space “is more commonly rented on a Triple Net basis, meaning that all expenses are passed through to or otherwise paid by the occupant.”
The bottom line here is, while I have no way of knowing whether this will come to pass, the “grossly inflated” rents are easily explainable by how the rents are calculated. And it is far from clear any of this changes estimates of property valuation or tax revenue.
Bottom line—I think it is really important, as this example shows, to ask a ton of questions so we can understand how these things were calculated.
I do agree with those who believe it would be more beneficial to have a range of numbers and to understand the sensitivity of the analysis.
That is another key question that the subcommittee asks. Here are their overall questions, it would probably be helpful if the city could put out the answers prior to the next meeting.
—David M. Greenwald reporting


it is not clear how much this kind of confusion actually matters in terms of the fiscal analysis
Actually it is very clear. The EPS model takes the $61 million of annual City expenses and divides that number by the number of residents plus 50% of the number of employees. If the number of employees is 27,897, then 50% of that is 13,949. If you add that to the population 69,791 the total resident equivalents is 83,710 and the per resident and per employee share of cost is $728.71
If the number of employees is 11, 271 the total resident equivalents drops to 75,397 and the per resident and per employee share of cost rises 11% to $728.71. That increases the Table B-1 Total General Fund Expenditures to $2,889,000 from $2,602,000 at the 75% expense ratio used by EPS.
Looking at the impact of the other requests by the FBC one by one.
If the EPS model is calculated at 100% as requested by the FBC, then the $2,889,000 expenses rise to $3, 611,000.
Then if the rather unrealistic occupancy values in Tables B-4 and B-5 are run at the historical City-wide averages, the $3,611,000 expenses rise to $4,678,000.
That reduced the Table B-1 General Fund Surplus at full build-out from $5,444,000 to $3,368,000
Looking at Revenues, if the City-County Revenue split moves from the 80-20 level in the model to 70-30, the loss of Revenues is $450,000. If it is modeled at the same 50-50 as MRIC was, the lost Revenues go up to $1,360,000.
If COVID restricts the project build-out to the Phase 2 level rather than Full Buildout, then $1,166,000 of Sales Tax revenue is lost and $934,000 of TOT revenue is lost ($2,100,000 combined).
Thanks for this, Matt.