
by Alan Pryor
The actual average increase in total annual compensation (Pay and Benefits) for City of Davis full-time, year-round (FT) employees has been 5.9% each year from 2011 through 2018. This is more than twice the average annual rate of inflation of 2.8% during the same period as determined by the US Bureau of Labor Statistics for Bay Area Urban Wage Earners & Clerical Workers. The actual average increase in salary without benefits (Pay) has been 4.5%.
The actual average annual total Pay and Benefits paid to City of Davis FT employees in 2018 was $144,115. Compare that to the average annual total Pay and Benefits of $118, 640 that would have alternatively been paid in 2018 if annual increases in total compensation had instead been held to the annual CPI increases since 2011.
Similarly, the actual average annual Pay (without Benefits) paid to City of Davis FT employees in 2018 was $97,834. Compare that to the actual average annual Pay of $88,324 that would have been paid to FT employees in 2018 if annual increases in payroll-only compensation had instead been held to the annual CPI increases since 2011
For comparison, median earnings for FT private sector workers in Davis was $63,125 in 2018. City employees thus received an average 55% greater Pay ($97,834/$63,125) and 128% more in Pay and Benefits ($144,115/$63,125) than FT private-sector workers in 2018.
The annual differences between the actual total Pay and Benefits paid by the City to all FT employees from 2012 through 2018 and that which would have been paid if annual increases had instead been held to the CPI is very substantial and ranges from $3.645 Million in 2015 to $7.668 Million in 2018. On a cumulative basis, the City has paid in excess of $34 Million more to FT employees in Pay and Benefits from 2012 through 2018 had annual payroll increases otherwise been held to increases based on CPI.
That additional money could have been very beneficially used in the intervening years to resurface many additional miles of the Davis streets and bike paths in most need of repair while still providing  adequate annual increases in employee compensation to match inflationary pressures on their costs of living.
INTRODUCTION AND BACKGROUND
The Coronavirus pandemic is causing substantial reductions in revenue across all sectors of government and is forcing drastic reductions in spending to accommodate these shortages. Recently, California Governor Gavin Newsom proposed a 10% reduction in pay to all state employees through furloughs along with pay raise and hiring freezes as well as a host of other money-saving proposals including reductions in state property leases and prison closures.
Gov. Newsom’s proposal, which requires approval from the state Legislature, relies on collective bargaining between his administration and state unions to reach agreements on how to achieve the 10 percent reduction in pay. However, Gov. Newsom is also seeking authority from the Legislature to force the reductions on employee unions if agreements cannot be otherwise reached. The proposed mechanism for pay reductions would be mandatory furloughs. Two furlough days a month would reduce salaries by 9.24 percent. The Governor’s proposal calls for the reductions to start on July 1.
In a recent presentation to City Council by the City’s budget consultant, Bob Leland, one of the options presented to overcome the City’s expected budget deficit next year was a mandatory one-day per month furlough for City employees. This was expected to produce near-term annual savings of $1.6M. Assuming the one-day per month furlough proposed for City Staff has the same relative % reduction in annual compensation per furlough day as the proposed State 2-day per month furloughs, this one-day per month furlough will result in an average reduction of 4.62% in pay to FT City employees. But employees would also be working one less day each month so their comparative hourly pay would not be reduced.
However, in Staff’s report submitted in advance for this coming June 2 Council meeting, this proposed one day per month furlough is not further discussed and the savings necessary to achieve a balanced budget are instead proposed to be realized primarily by reducing the Capital Improvement Project (C.I.P.) budget by over $7 Million this coming year. This would postpone many already-scheduled and needed street and bike path maintenance and improvement projects.
It is important to note that the City’s current $259 million budget shortfall in capital maintenance is primarily due to past decisions by our City Councils to repeatedly defer such needed maintenance in favor of annually increasing employee salaries in excess of then existing rates of inflation. Adding $7 million a year now in additional deferred maintenance will simply increase the future maintenance budget shortfall from $259 million to $287 million over 4 years. The bottom line is that the proposed deferred maintenance expenses will not actually go away. The costs will simply just be delayed until a future time when the costs of the necessary maintenance will increase even more do to further deterioration of our infrastructure..
It is also unclear if the currently planned 2% payroll increase effective July 1, 2020 that was negotiated as part of a multi-year Memorandum of Understanding approved by the City with its labor groups in 2018 is still going to take place. If the City follows Governor Newsom’s example and rolls back employee pay by 10%, the planned increase would not occur and the compensation savings would also be a true reduction in expenses.
This absence of any material sacrifices by City employees thus far to help alleviate the massive City budget shortfall is incongruous with the payroll reductions otherwise announced by the State as part of their overall budget-balancing strategy. This is particularly true in light of the fact that City of Davis employees, in particular, have received very generous employee pay raises far in excess of rates of inflation over the previous 9 years since the depths of the Great Recession.
If the City employees had their salaries rolled back by 10% similar to those cuts proposed for state employees, their compensation would still be way ahead of what they would otherwise be receiving had their salary increases been limited to annual inflation rates over the past 9 years.
To determine the overall financial impacts on City finances, it is instructive to determine the extent of actual payroll and benefit increases granted employees compared to if compensation increases had instead been based on rates of inflation over the same 2011-2018 time-frame.
ANNUAL COMPENSATION INCREASES OF CITY OF DAVIS FT EMPLOYEES FROM 2011 – 2018 COMPARED WITH INCREASES IF BASED ON ANNUAL CONSUMER PRICE INDEX
Payroll and benefits information necessary to conduct such an investigation is reported annually through Public Records Act requests by all California state, county, municipal, and UC system employers to the independent non-governmental, non-profit watchdog organization, Transparent California (www.transparentcalifornia.org). Downloaded summary information showing total and median employee compensation and other statistics for the entire City are shown in Appendix A.
Note that the payroll data from Transparent California is only available up through the calendar year ending December 31, 2018. Year-ending data for calendar year 2019 will only be available from Transparent California when received from the various government agencies and posted later this summer. As such, payroll and benefit increases for City of Davis employees that have already become effective on the start of the current fiscal year (beginning July 1, 2019) are not reflected in the following discussion and the total impacts of payroll and benefit increases are thus understated.
Additionally, regular payroll and overtime pay (collectively referred to as Pay) and total compensation including payroll benefits (hereinafter referred to as Pay and Benefits) are reported each year for each individual employee of the City (e.g. see https://transparentcalifornia.com/salaries/2018/davis/ for employee salary records for 2018).
By segregating the annual payroll data for individual FT city employees from part time employees, the average Pay and average total Pay and Benefits for FT City employees can then be calculated. This in turn allows the average annual percent increases or decreases in Pay and Pay and Benefits for all employees of the City to be determined and compared to annual increases in the CPI as reported for Bay Area Urban Wage Earners & Clerical Workers by the US Bureau of Labor Statistics (https://data.bls.gov/timeseries/CWURS49BSA0).
The differences between the actual annual percentage changes in compensation received by FT City employees and the annual increases in the specified CPI rate are shown in the following graph. Also see Appendix B for the details of these and other compensation calculations discussed below.
 To summarize the above information, the average annual increase in the CPI from 2011 through 2018 as reported for Bay Area Urban Wage Earners & Clerical Workers by the US Bureau of Labor Statistics is 2.8%. The actual annual average increase in Pay and Benefits for City of Davis FT employees is 5.9% and the actual annual average increase in Pay for FT City employees is 4.5%.
Keep in mind that the Bay Area Urban Wage Earners & Clerical Workers CPI is unusually high compared to other measures of CPI because it very strongly is influence by soaring housing costs in the Bay Area. These impacts are generally more muted in the Sacramento region. Additionally, the CPI used by the Social Security Administration over the same time period for determining annual cost-of-living increases is less than 1.5%.
Using the above information, the differences in average annual compensation between what was actually paid to City employees can then be compared to the compensation that would have been paid if Pay and Pay and Benefits were instead increased by the CPI as shown in the following graph.
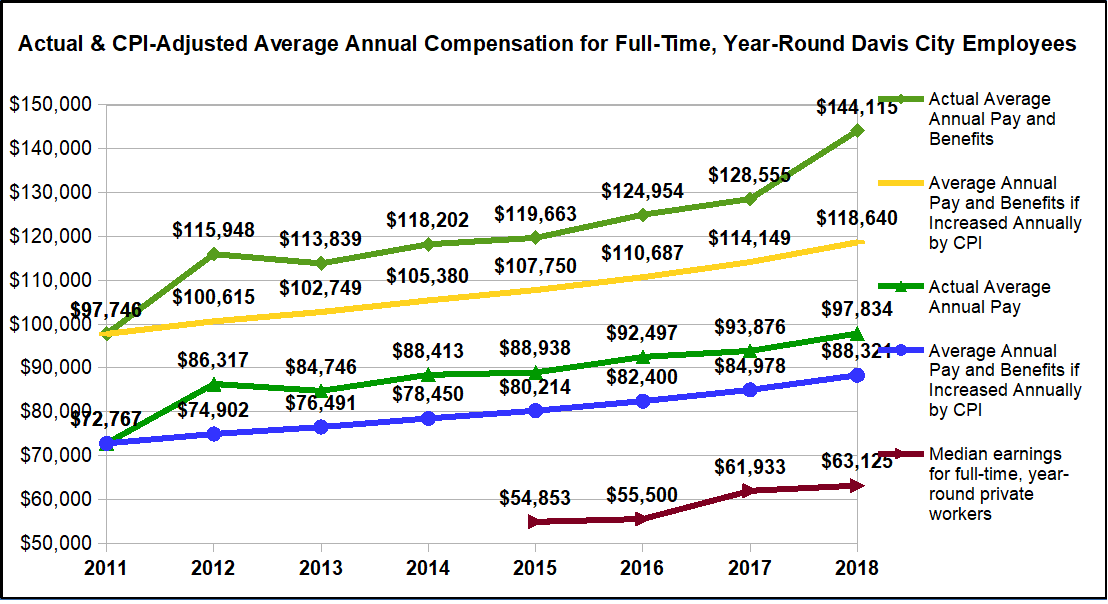
As can be seen from the above graph, the greater percentage of annual increases in Pay and total Pay and Benefits actually given to FT City of Davis employees over and above the CPI-defined inflation rate has resulted in an increasing spread between compensation actually paid to FT employees compared to that which would have otherwise been paid if annual increases had instead been held to the percentage increases in the CPI.
For instance, the upper two lines on the graph show the average annual total Pay and Benefits actually paid to City of Davis FT employees which equaled $144,115 in 2018 compared to $118, 640 that would have been paid, on average, if annual increases in total Pay and Benefits had otherwise been held to the annual CPI increases since 2011.
Similarly, the middle two lines on the graph show the average annual Pay paid to the City’s FT employees which equaled $97,834 in 2018 compared to $88,324 that would have instead been paid in 2018, on average, if annual increases in Pay had been held to the annual CPI increases since 2011.
For comparison, the bottom line on the graph shows average median earnings for FT private sector workers in Davis which was $63,125 in 2018 (also see Appendix A). City employees thus received an average 55% greater than this amount in 2018 in Pay ($97,834/$63,125) and 128% more in Pay and Benefits ($144,115/$63,125) than average private sector workers in Davis in 2018.
TOTAL COSTS OF EMPLOYEE COMPENSATION INCREASES TO THE CITY
The difference between the actual total Pay and Benefits paid by the City to all FT employees from 2012 through 2018 and that which would have been paid if annual increases in Pay and Benefits had instead been held to the benchmark CPI is very substantial ranging from $3.645 Million in 2015 to $7.668 Million in 2018.
On a cumulative basis, the City paid in excess of $34 Million more to employees in Pay and Benefits from 2012 through 2018 had the annual increases in compensation otherwise been held to annual increases in CPI. This is shown in the following graph

The $34 Million+ that would have been saved by the City had employee compensation increases been held to the CPI from 2011 through 2018 would have paid pay for a lot of infrastructure and road repair that was otherwise been deferred by the City and now accumulates as increasing unfunded liabilities.
MISREPRESENTATION OF EMPLOYEE COMPENSATION INCREASES AND CONTINUED FAILURE TO ACCOUNT FOR UNFUNDED PENSION LIABILITIES BY THE CITY
The City has been misrepresenting the extent of annual employee compensation increases and has failed to properly account for associated unfunded pension liabilities for some time.
For example, in an article published on June 26, 2018 in the Davis Vanguard entitled “Sunday Commentary: The MOUs We Signed Should Not Be Cause for Alarm” (https://davisvanguard.org/2018/06/sunday-commentary-mous-signed-not-cause-alarm/), it was reported that the City recently signed Memorandum of Understandings (MOUs) with the City’s employee labor groups ostensibly granting, according to the Staff Report at that time, only a 2% retroactive salary raise and three years of future 2% annual salary increases.
These MOUs were approved at that time despite a number of citizen complaints (including by this author) that the process of approving the long-term MOUs with excessive employee compensation increases was inconsistent with the stated goals of cost containment that the Council had been touting because the actual net increase in total compensation granted to employees had a net impact on the City budget far greater than the reported 2% per year.
The Vanguard article echoed and defended the City’s position in the MOUs in the article stating,
“The notions of thinking about the contract in terms of total compensation and using the contract to mitigate risk are highly innovative and the council deserves a lot of credit.”
Matt Williams (then on the Finance and Budget Commission) commented in response,
“There is absolutely nothing innovative about thinking about employee costs in terms of total compensation … absolutely nothing! The community dialogue, especially here in the Vanguard over the last 3-4 years has been almost 100% in terms of total compensation…So, all the council was doing was catching up with what their constituents had already been doing for 3-4 years.
What risk did the contract mitigate? The simple answer to that question is no risk whatsoever.
Why no risk mitigation? For the following reasons …
(1) The 2% annual COLA (8.25% over the 3 year and 12 day term of the MOU) is 68% higher than the average annual COLA granted by the Social Security Administration over the last 9 years.
(2) The 6/30/2016 CalPERS Actuarial Valuation report shows 245 “active” members of the City of Davis Miscellaneous Plan. Over 31% of those “active” members will actually not receive an 8.25% increase, but instead will receive in excess of an 18% increase.
(3) Another 40% of those “active” members will actually not receive an 8.25% increase, but instead will receive in excess of a 12.5% increase.
(4) Only 28% of the “active” members will actually receive the 8.25% increase.
(5) The 18% increase bumps up the Pension Qualifying annual compensation by at least 18% (possibly more), which means the City’s Pension liability goes up substantially thanks to these MOUs.
It will take a Masters in Political Spin to transform those factual realities of the MOUs into “highly innovative risk mitigation.”
And so here we are today, almost two years after the City was reporting annual total compensation increases of only 2% per year, and we find out that actual compensation increases were far greater just as Mr. Williams indicated would happen.
Further information on the extent of the under-reporting of the City’s unfunded pension liabilities is discussed in Appendix C.
Additional updated information will be provided when 2019 payroll data is made available by Transparent California in the coming months.
APPENDIX A – SUMMARY OF ANNUAL EMPLOYEE COMPENSATION OF CITY OF DAVIS EMPLOYEES AS REPORTED BY TRANSPARENT CALIFORNIA
The following table shows summary statistics of City of Davis employee compensation as reported by Transparent California (www.transparentcalifornia.org).
Inspection of this data shows a strong, generally increasing trend in median employee Pay and total Pay and Benefits from 2011 through 2018. It also shows a fairly sizable 17% increase in annual employee costs per Davis City resident from $627 in 2015 to $734 in 2018.

APPENDIX B – CALCULATIONS OF ACTUAL ANNUAL EMPLOYEE COMPENSATION INCREASES COMPARED WITH INCREASES BASED ON RATES OF INFLATION
Compensation of full-time, year-round (FT) city employees from part time employees in the listings of the individual annual payroll details for all employees of the City are segregated to calculate the average Pay and average total Pay and Benefits for FT City employees.
This in turn allows the average annual percent increases or decreases in Pay and Pay and Benefits to be determined and compared to annual increases in the CPI as reported for Bay Area Urban Wage Earners & Clerical Workers by the US Bureau of Labor Statistics (https://data.bls.gov/timeseries/CWURS49BSA0).
In this manner, the differences in annual compensation between what was actually paid to City employees were then compared to the compensation that would have been paid if Pay and Pay and Benefits were instead increased by the CPI as shown in the following table.

APPENDIX C – DIFFERENCES IN METHODOLOGY IN REPORTING TOTAL COMPENSATION FOR CITY OF DAVIS EMPLOYEES IN 2018
One contributing factor to the unusually large increase (12.1%) in total Pay and Benefits in 2018 is that Transparent California now reports unrecognized pension liability as compensation in a separate category called “Pension Debt” for the first time in 2018 (see https://transparentcalifornia.com/salaries/2018/davis/).
Transparent California explained the addition of this new reporting category as follows;
“What are pension debt payments?
The cost associated with employer-provided retirement benefits is comprised of two components: the normal cost and the unfunded liability (debt) payment.
The normal cost is the amount the pension fund determines is necessary to pre-fund that employee’s future benefit. But because this cost is calculated based on a series of projections about future events, they oftentimes end up being insufficient to fully fund the employee’s promised benefit.
When this happens, an unfunded liability (debt) is created. In order to pay this debt down, the annual retirement costs are increased accordingly.
Beginning in 2017, agencies belonging to the state pension fund (CalPERS) are only required to report the normal cost portion — which gives the erroneous impression that their annual costs have significantly declined.
To ensure the full annual cost of employee compensation is reported, and to maintain parity with the reporting methods used by non-CalPERS agencies as well as all CalPERS agencies prior to 2017, Transparent California prorated these agencies’ pension debt payments across all employees. This prorated value is reported under the “pension debt” column.
The pension debt column does not appear for any agency prior to 2017, as that cost was already included by the reporting employer as part of their retirement costs.
Similarly, it does not appear for the agencies that continue to report their full retirement costs to Transparent California.” (Bold emphasis added)
Regionally, both Woodland and Winters saw such new categorical disclosures in their total compensation reflecting accrued “Pension Debt” as reported by Transparent California. West Sacramento and Yolo County did not have these categories in their payroll disclosures for 2108 by Transparent California seemingly indicating that they have been adequately accounting for their full pension obligations up through 2018.


A few things. What happens if you start the series earlier or later? Notice that the biggest jump is in 2012 the first year of the study. If you start in 2013 I would guess that the numbers would be more in line with the comparable averages for the period 2013-2018.
The next question is why the big jump in 2012? My guess is the answer is to make up for delayed increases during the Great Recession so starting earlier say 2010 would likely smooth out the delta with the comparables. Also, isn’t 2012 when Jerry Brown changed the contributions to the pension funds that had become underfunded during the economic downturn?
I do understand the point that it might be better to add another furlough day instead of reducing the road budget but we might also consider how much less people are driving since the pandemic started and how it has flattened the curve for deferred maintenance.
Tranparent California only has data going back to 2011 so I used everything they had. I will update these numbers when they release the 2019 salaries.
Okay I get why you started in 12 then but what happens if you start in 13?
A number of factors, not addressed in the article posted… starting in 2012, salaries were increased, in large part to offset the change in employee contributions to PERS… went from 0% (City paid employee share, started in the ’80s where employees got little/no salary increases, but City picked up employee share (which was then 7% for miscellaneous employees – with 2% @ 55, that went to 8%, when City adopted the 2.5%@ 55 [Misc]). Starting in 2012, employees were going towards paying the 8% employee share (higher for PS, which had a 3% @ 50 plan), out of salary… so City gave more in salary to offset that. Also, based on the 2007-2011 PERS returns, PERS substantially increased the employer contributions, coinciding with the State (who feeds Transparent California, a private, for profit firm based in NV) reporting employer contributions as ‘compensation’ (not all public agencies did so, BTW). [Transparent CA is not as transparent as their moniker would imply… they get their info for free from the State (Public Records) then report it out, gaining revenue from ads you have to wade thru to see the data].
Other points… author flips thru ‘median’ and ‘average’ as if they were interchangeable terms… and does not appear to “normalize” between private/public job descriptions… effect is to include FT burger-flippers and compare to professional engineers, planners, finance folk, as well as maintenance workers…
Author included a lot of “data”, and yet makes no recommendations, offers no solution… leaves that to others… a good risk-adverse strategy…
BTW, for employees first hired after 2013 (?) have much reduced PERS benefits… and with the City, much reduced PERB if retiring (health insurance, which also means only Medicare and supplement to Medicare, for those eligible for Medicare… some of those hired before 1986 +/- are not eligible for Medicare, unless via a spouse)… facts not mentioned in the article… logical… it is not fully factual, and does not recommend a course of action.
I have only ever seen one ad on the Transparent California website using Internet Explorer; as follows
Do you have any other information to support your assertions?
Bill
Shouldn’t tracking total compensation address the issue of shifting employee contribution shares?
Yes, it should… but the way the post was written, it didn’t…
My understanding is now City employees are paying for a portion of the employer share… don’t know if that employee payment is pre- or post- taxes…… again, no recognition of that… one-sided, directed towards a point that really wasn’t made…
Transparent CA doesn’t do so, either…
Figures don’t lie, but…
Generally compensation reporting does not including any employee-paid benefits. The reporting is the same used for income taxation. W-2, etc. So I expect that the numbers are net of the employee payment for the benefits.
But there are other pieces missing here…
– the value of social security benefits for the private sector employee (likely favoring the private sector employee except if younger… and then in that case, maybe favoring the City employee for not having to pay into something that will never pay any benefits as it will be insolvent in 10-20 years).
– the number of paid holiday and paid vacation days (favoring the City employee).
– the value of job security (favoring the City employee)
The problem is obvious, when compared to the 2% cap on property tax increases allowed for properties that aren’t reassessed (under Proposition 13 – for both residential and commercial properties).
Of course there’s going to be a problem, if costs aren’t similarly controlled.
And it will occur again-and-again (throughout California), until that underlying problem is addressed.
Worth noting two quick points. First the bulk of the cost increases are due to pensions rather than salary. Second, the difficult in cuts is the collective barganinig process. I’ve long recommended instead of cuts, we simply hold the line on compensation over time
Gee… wish I had noted that…
But at least you have made recommendations…
Sounds like a good (and already-ignored) starting place, but:
Has anyone done the math, to see if holding the line on salaries would actually work at this point? (Again, a problem throughout California.)
And, each time that salary is increased, so do pensions.
I suspect that the entire system (statewide) is headed toward collapse, and will become even more evident due to the impact of the coronavirus . (Sometimes, collapse has to occur, before there’s a “cure”.)
To clarify further, is this what you propose to “hold the line” on, at this point?
Also, are built-in raises already going to increase this “per-employee” cost even further, over time? Regardless of what you (or anyone else) “thinks” should occur?
Along with the corresponding pensions (and benefits)?
Average salary only increases from 2011 – 2018 was 4.5% vs 2.8% CPI. Average salary only in 2018 was $97,834. With the 2019 increases, I am guessing it went to over $100,000 per year and the 2020 increases are still looming
I have never seen you make that recommendation except back in the days when the fire department ruled the City and they got 36% over 3 years.
This is a great bit of work from Alan Prior. It is nice to see it all together in one place and backed by reasonable reliable data sources.
A couple comments.
The value of the pensions for Davis city employees should be normalized and monetized… and then added to their overall compensation. This is needed because it is a defined benefit plan. The formula for this would be the same as an annuity calculator.
For example, taking 80% of that $97,834 average salary. Assuming an average retirement age of 60 after 30 or more years of service and death at 85, and assuming a 5% ROI (low-risk investments and incorporating CPI), funding that annuity would require $1,158,245.
Then using a savings target calculator assume a 6.5% ROI, it would take $1,117.45 per month over 30 years to get to the $1,158,245 target. Or another $13,409 per year in compensation minus what the employee contributes.
My second comment here is that this is only the expense side of the issue. Davis also brings in much less general fund revenue per capital than does any comparable city. No doubt we are paying too much for city labor, but we are also blowing the opportunity to leverage our gem of UCD to develop our economy to bring in more revenue to help pay the bills.
Bill, you personal antipathy for transparentcalifornia has been expressed over and over again. So, with that acknowledged, do you have a better alternative solution for making the relevant data available to the public?
Moving on to the concern you raised about Alan offering no prescriptive remedies, isn’t the Vanguard supposed to be a dialogue space? If Alan had gone the prescriptive remedy route, then his article would have become a lecture rather than an engagement. Leaving the door open for the Vanguard readers to venture forth with their thoughts is a very wise move in my opinion.
Our City government is facing some very difficult times. Our Governor has proposed a 10% pay cut for all State employees. How would you feel about a 10% pay cut for City employees?
Full disclosure, at the June 11, 2018 FBC Meeting I made the following three motions (in writing) which died for a lack of a second. The first motion is particularly germane to our current situation.
Matt Williams submitted a separate written motion as follows:
Motion #1: The Finance and Budget Commission recommends that City Council take proactive steps to accomplish the following:
· Direct the City Manager to direct all City Departments to assemble a “90% Budget” identifying where they would;
a. Reduce the budgeted expenses of their Department by 10% from the Proposed FY 2018-2019 Budget, and
b. Identify any services currently delivered by their Department that would be impacted by their proposed cuts
c. Present their 90% Budget to the City Manager, so that the City Manager can present the consolidated 90% Budget to City Council before the end of the First Quarter of FY 2018-2019.
Motion #2: The Finance and Budget Commission recommends that City Council take proactive steps to accomplish the following:
· Create a Cost Containment Taskforce, the goal of which will be to:
a. Substantially increase citizen/taxpayer/voter involvement and awareness of the City’s costs of delivering current City services,
b. Create a community dialogue regarding the tradeoffs between the Proposed FY 2018-2019 Budget (the 100% Budget) and the 90% Budget created by the Departments.
c. Create a community dialogue about how best to spend the approximately $6 million per year difference between the 90% Budget and the 100% Budget. For example, should the $6 million be spent
i. Retaining/continuing some (or all) of the services the Departments have identified as impacted (reduced or eliminated) by the 10% cuts in the 90% Budget, or
ii. Addressing the $7.8 million Budget Shortfall in Capital Infrastructure Maintenance.
d. Use the items contained in Attachment A and Attachment C as a beginning point for creation of the Taskforce Mission and Goals.
Motion #3: The Finance and Budget Commission recommends that City Council take proactive steps to accomplish the following:
· Update the Council Goals as formally recommended by the Finance and Budget Commission by unanimous formal motion adoption on February 13, 2017. The recommended Updated Goals are included herein as Attachment D
Davis specific recommendation, with respect to OPEB benefits to be conferred upon qualifying members of the City Council:
1) Effective Immediately for all future Councilmembers:
a. Replace the historical, non-prefunded arrangement – under which Councilmembers have been secunded into the City’s program of unfunded liabilities for “Other Post Employment Benefits” – thereby removing potential conflict which might otherwise compromise execution of their duties in the governing and oversight of the City’s OPEB program, while not depriving Councilmembers of a comparable and equitable alternative form of remuneration;
b. Change compensation/remuneration model to menu driven model based upon the current standard stipend plus an allowance equal to the present value (assuming a current discount rate based on repeatable, actual returns of the fund’s investment portfolio) of the OPEB benefit with the following options:
i. Take all benefits as current compensation – including a fixed value of future health benefits -with appropriate withholding.
ii. Take all benefits as a defined, deferred annuity – including a fixed value of future health benefit. Annuity to be transportable and independently administered following issuance with no recourse to the City or local taxpayers.
iii. Some combination of the above Compensation component together with a lifetime healthcare benefit (with a defined premium structure) as determined and administered by the Healthcare issuing agency (such as Kaiser) with no recourse to the City of local taxpayers. In other words, get the City and the taxpayer out of the business of forecasting and guaranteeing future medical insurance premium costs. If the carriers and providers, together, are unwilling to forecast a lifetime premium value – why should be the City be on the hook for unlimited liability in connection with this benefit?
iv. Restore the original intent of California’s “County Employees Retirement Law”, mandating the responsibility and authority for full, actuarially-determined, priority funding of each year’s required contribution – thereby matching the annual contribution expense with the Councilmember’s actual term of service each year – so as to insure a fair and accurate current budget, and that their service is not further contributing to and exacerbating the future unfunded balance of the City’s existing programs.
N.B. –
Concerning paragraph item iv, above, I realize this is a difficult concept for non-accountants to absorb – that is the idea of matching an employee’s actual term of service with the allowable, maximum term over which all necessary contributions are made on an annual basis – such that upon transfer or retirement of the covered employee, there is no subsequent, unfunded/underfunded liability in connection with their past years of service.
This point was addressed by GASB Staff in their 2007 report to the GASB Board as follows:
Why Has the GASB Issued New Standards for OPEB?
The GASB established standards in 1994 for how public employee pension plans and governmental employers participating in pension plans should account for and report on pension benefits, but similar provisions did not exist for OPEB. Although the OPEB may not have the same legal standing as pensions in some jurisdictions, the GASB believes that pension benefits (as a legal obligation) and OPEB (as a constructive obligation in some cases) are a part of the compensation that employees earn each year, even though these benefits are not received until after employment has ended. Therefore, the cost of these future benefits is a part of the cost of providing public services today. However, most governments report their cash outlays for OPEB in a given year, rather than the cost to the employer of OPEB earned by employees in that year; these two amounts may be vastly different. In the absence of standards similar to those the GASB enacted for pensions, most governments do not report the full cost of the OPEB earned by their employees each year.
Furthermore, most governments do not report information about the nature and size of their long-term financial obligations and commitments related to OPEB. Consequently, the readers of financial statements, including the public, have incomplete information with which to assess the cost of public services and to analyze the financial position and long-run financial health of a government. The purpose of the new standards—GASB Statement No. 43, Financial Reporting for Postemployment Benefit Plans Other Than Pension Plans, and GASB Statement No. 45, Accounting and Financial Reporting by Employers for Postemployment Benefits Other Than Pensions—is to address these shortcomings.
That is correct.
Good question.
IOW
taxpayers = chumps by any other name.
With apologies, if like recent assertions concerning the term “thugs”, “chump” is somehow deemed to be a racially charged term.
As Leona Helmsley famously said in front of her housekeeper “We don’t pay taxes; only the little people pay taxes.”
I guess I’m a chump.
I wonder what Donald Trump has paid in taxes?
I just saw this story (and didn’t fully read it), but couldn’t help but think of the topic of this article (in regard to government pensions):
https://www.msn.com/en-us/news/us/last-person-to-receive-a-civil-war-era-pension-dies/ar-BB14WxEa?ocid=msnews
The “original” 1937 Act CERL pension model was “designed” to be fiscally and financially sustainable – recognizing that only the Fededal government is authorized to print money.
It worked pretty well until the late 90’s when CA. gave away the store. Now we can’t seem to dig our way out. Of course with the lack of growth championed by the author of this piece we have never gotten serious about trying to grow our way out.
That’s what’s referred to as a “Ponzi scheme”, resulting in continued and never-ending sprawl.
Which hasn’t even “solved” the fiscal challenges faced by communities which pursue that model.
Not really a Ponzi scheme. In a Ponzi scheme you use new money to pay off old money until the thing goes belly up. With pensions the money is invested and grows over time. The problem is that in the late nineties they raised the payouts without funding the raises. Fiduciary irresponsibility yes. Ponzi scheme no.
I was referring to your quoted comment above, not what you followed up with.
Only by ignoring demographic trends – approving a younger retirement age even as life expectency continued to rise.
There is no expectation of fiduciary responsibility or accountability.
“There is no expectation of fiduciary responsibility or accountability.”
Ouch! We should expect the former and demand the later.
Who would take the job?
In 1937, when the California retirement act was first adopted – life expectancy for men was 58, by 1998 it was 73.8. Life expectancy for men at age 65 was 11.8 years in 1937, 16.6 in 2007. Retirement age in 1937 was set at 65 years with early at 60. By 2007, retirement age had dropped to 55, with early at 50. We are now back to 62 and 57 as of 2019.
I’m no actuary, but the numbers don’t lie.
Another key protection (for employees and taxpayers alike) was the 1937 Act directive authorizing and empowering the County Auditor to execute a command draw on any and all available funds to immediately restore actuarial balance – upon determination of an actuarial shortfall (based on regular audits) – to the underlying pension Trust Fund in the event that County Supervisors failed to take action.
These framers and drafters of California’s original County Employee Retirement Law weren’t fooling around.
By starting a year later, and using 2012 as a base, salary has gone up around 2% a year and total comp about 4% a year. If you assume that there are reasons why the big increase in 2012 happened, such as deferred increases during the Great Recession, the increases over the last six years are not out of line with the comps on a percentage basis. If anywhere, Davis has likely overcompensated in pension contributions. Of course this is because of the huge unfunded pension increases granted around the turn of the century. In fact, since the longest serving members of the current CC have only been serving since after the 2012 budget, a good case can be made there has been a great degree of fiscal discipline by the city under the current elected leadership.
“revenue” is also deferred (and sometimes permanently lost), during recessions.
If costs are allowed to exceed revenue over time, there’s going to be a problem. It’s ultimately that simple.
And, the system itself is set-up to allow that to occur, repeatedly. (Not just in Davis.)
And again – if salaries go up, so do resulting pension costs. (Same thing is true regarding school districts.)
“Only by ignoring demographic trends – approving a younger retirement age even as life expectency continued to rise.”
Until the late 90’s the pension funds were in decent shape, of course some better than others. Then they gave away the store not only lowering the retirement age but also increasing the payout percentage/year of service. Of course the nasdaq was supposed to go to infinity and if your numerator goes to infinity it doesn’t matter what your denominator is. Sadly, it didn’t work out that way and the bill has come due.
In short, and based on the record, I don’t believe the original drafters and framers of the law ever intended for future generations of taxpayers be saddled with the bills not of their making.
Again it is only the Federal government which is authorized to print money. That used to mean something.