
By David M. Greenwald
Executive Editor
Davis, CA – The City of Davis in their press release this past Monday led with the headline, Davis use of force “…Found to be Well Below State Average.”
On the one hand, I think that’s probably true, which is why I used the headline even though it  kind of frames the issue in a way that’s probably not that helpful. As I said earlier this week, if I had to put my finger on the problem facing DPD it would not be use of force, but rather police stops and racial profiling.
But as we drill down a bit more, there are a lot more problems—some become obvious when you look at the Use of Force Case Summaries.
 Michael Gennaco, the Independent Police Auditor himself, issues a bit of a caveat.
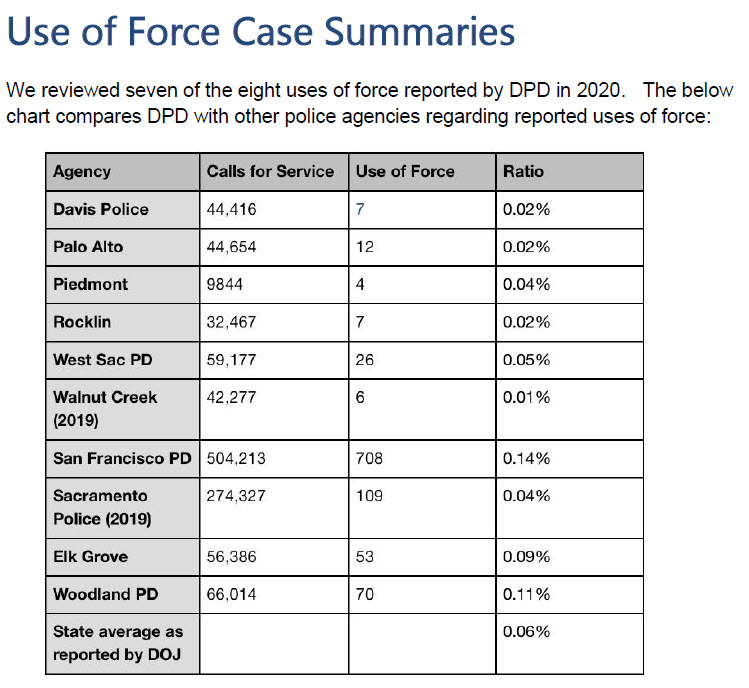
In the report he notes: “While these numbers indicate that DPD’s use of force is well below the California state average as reported by the State’s Department of Justice, because there is wide variability on what each agency reports as a use of force, the comparability between police departments is helpful but not determinative. Moreover, despite efforts toward increased transparency in California, DPD and other police agencies set out in the chart above are still a minority when it comes to regularly and timely publishing use of force numbers.”
As he explained at the PAC meeting on Monday, “It is with a little bit of trepidation that I feature this table because the data is only as good as the data is good.”
He said, “I strongly suspect that most of this data isn’t very good.”
Gennaco hits on one problem—measurement error.
“(U)se of force data has been proven throughout the country, throughout the state of California and elsewhere to not be good,” he said.
Gennaco cited the New York Times article that determined there was an under-reporting of officer-involved shootings, in a magnitude of maybe 50 percent.
A week ago Friday, the NY Times reported on a study published in the Lancet and conducted by the University of Washington: “Police killings in America have been undercounted by more than half over the past four decades, according to a new study that raises pointed questions about racial bias among medical examiners and highlights the lack of reliable national record keeping on what has become a major public health and civil rights issue.”
Gennaco pointed out, “If the data for officer-involved shootings, which are significant events, is that far off from reality, I have no doubt (use of force data is probably worse).
“But this is the data that there is. To the degree that there is data, Davis looks pretty good,” he said adding, “I know that the data for Davis is accurate, but I’m suspect of what I can’t affirm is the data for all other departments.
“It also may be an apples and oranges thing because different jurisdictions, different types of use of force [present] differently,” said.
He used an example, in about 30 percent of the jurisdictions in California, when an officer takes out his or her weapon and points it at a suspect that’s considered a use of force—Davis does not.
“So for those jurisdictions that count that action as the use of force, they’re going to necessarily have higher numbers and be sort of out of whack with the jurisdictions that don’t report that as a reportable use of force,” he said.
This is one problem, but it is not the only problem with this kind of comparison.
One question I would have—is a ratio really the best way to go in order to create a comparison? I understand that, given the size of jurisdictions, you want to baseline it. After all, Davis had only 44,000 calls for services while San Francisco had over half a million—obviously you need to standardize the comparison if you want to compare.
But if we were going to do an academic study on use of force, we would probably make use of a multivariate regression model, rather than a straight ratio. One reason for that—the straight ratio does not account for types of crimes and types of calls that are occurring.
As I pointed out earlier this week, Davis is a relatively low crime area and the crime that we do have tends to be things like bike thefts and burglaries—not things that are going to be caught in progress by police officers and thus unlikely to trigger a use of force.
If the call for service is coming next day to take a report on a bike theft, a catalytic converter theft, or a burglary, the chance of there being an confrontation is almost zero.
That definitely matters.
Finally, while looking at use of force is helpful, what we really want to evaluate is when the police are using excessive or unlawful force. Sometimes it takes force for police to lawfully take someone into custody, they are permitted to do so, and they follow the law in doing that.
While I do believe that some use of force that is lawful is avoidable—I am not sure, as a simple measure for use of force, that taking them as a whole is that helpful.
So is Davis following the laws on use of force? That’s where we might have some differences of opinion.
Earlier this week I flagged two that looked problematic—one would probably be unlawful under current state law, the other should have been addressed with a Crisis Now approach (except we didn’t have one).
Gennaco has noted that, while the December 2019 shooting was not included, he was not happy with the reviews done by the West Sacramento Police—or the DA on it, and is still reviewing it (so it was not included).
Overall, three cases involved a subject that was mentally ill, while force involved subjects that were possibly mentally ill.
It should also be noted, “DPD supervisors determined, without any written analysis, that the use of force was within policy in all cases.”
That leads me back to … is a ratio a helpful measure? It is not clear that it is. After all, if you live in a place where you have a strong evaluation system and determine all uses of force were clean, should you be flagged as an agency if they are above state average?
On the other hand, if you had a number of problematic use of force cases—either improper or suspected to be—isn’t that a problem regardless of the overall ratio?
While I look at their comparisons, I have grave questions. On the low end, you have Davis at .02 percent, the same as Palo Alto and Rocklin, and that makes some sense. Slightly above Walnut Creek (which, by the way, had a fatal shooting last year that is under investigation).
On the high end, you have San Francisco at 0.14 percent, and it makes sense they are on the high end—having been in court there, we saw a LOT of force used by police.
Then there are some suspicious data—Woodland at 0.11 percent is a lot higher than I would have suspected. West Sacramento at 0.05 percent is a lot lower. And Sacramento at 0.04 percent is quite suspicious.
At the end of the day I believe Davis is below the state average, but I’m not sure what that state average actually is and whether the measure is very useful for accessing the actual problem.


Truer words. Seriously. Truer words have never been spoken. So very, very true. True true true true true.
I think you’re gonna have to prove that with data. And I think it goes without saying, that data better be good.
Did he use good data to make that statement? Because if not . . .
I hope you suspicions are gooder than the data.