Editor’s Note: On Thursday, Interfaith Housing Justice of Davis presented “Davis Housing Solutions: A Community Conversation” – a forum at the Davis Community Church. What follows are the full comments by Kelly Stachowicz, Assistant City Manager, City of Davis.
Full comments by Kelly Stachowicz
The city has something called an affordable housing fund. She called it a housing trust fund. Same idea, the city of Davis, has different buckets and those different buckets we put money into. And the different buckets have different requirements. Some are very fungible. So our general fund is money that we can use for any kind of governmental purpose of what the city does. So fire police, we could use it for housing, it can be used very widely. We have other funds that are very, very specific. For example, our wastewater fund, it’s only funded by rates and those rates have to go to pay for that utility. It cannot be used for anything else. So if we had extra money in our wastewater fund, we couldn’t just transfer it over and use it for affordable housing or any other purpose in the middle.
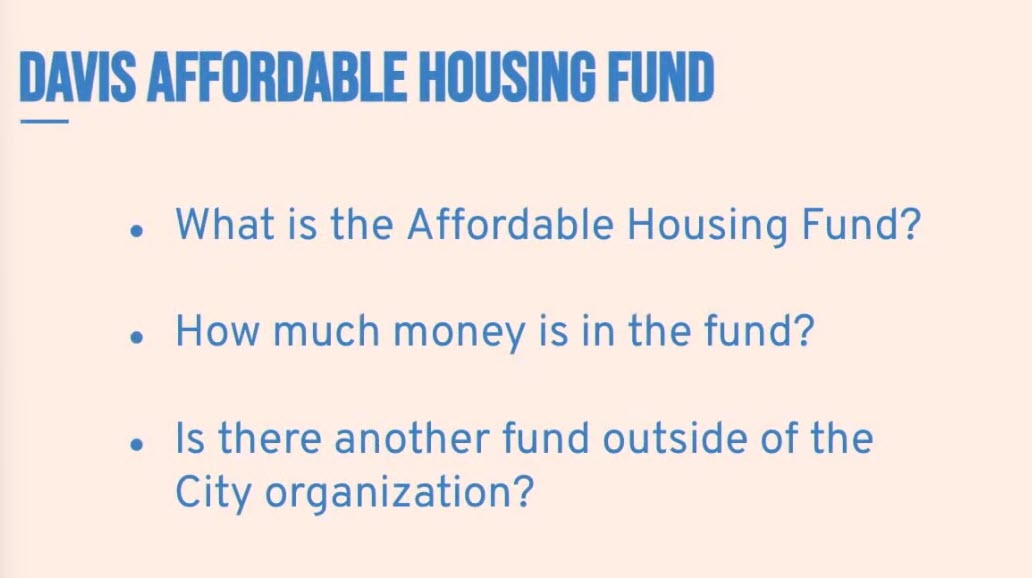
We have a whole bunch of other funds that we can use for different types of purposes. One of those is our affordable housing fund. This was originally set up when the city had something called redevelopment and in that point in time there was something called a set aside, a housing set aside. So money that came to the city from our redevelopment agency, our redevelopment area, we were required to put 20% of it into this housing set aside. So at its height that meant that this fund, which had to be used for affordable housing, was getting up to $2 million a year. That ended in 2012 when the state discontinued redevelopment agencies. And since that time, so for the past decade plus, we’ve been trying to figure out how do we get a source of funding that is ongoing and sustainable like that housing set aside; we don’t have the answer yet, so still working on that.
How much is in our fund right now? So we’ve continued the fund, we have it, the money that goes into it, we still only use for all of the things along the spectrum that you’ve been hearing about this evening. So it could be anything from funding that goes toward homelessness activities or services or shelter all the way up to funding that is  for ownership. Ownership housing for affordable levels. We have about $600,000 that’s not connected to anything right now. It’s able to be spent, but that’s it. But where do we get these dollars? Where do they come from?
Is there another fund outside of the city organization? I would be remiss if I didn’t mention that. Due to the leadership of Georgina and a number of other folks in this room, about a year ago, the city was able to set up a fund through the Sacramento Regional Community Foundation that is a city of Davis affordable housing fund and put some seed money into it. So about $10,000, not a lot, but it was matched with private contributions exceeding $5,000. And that is a way that individuals in the community, if they don’t want to write a check to the city of Davis, because that generally doesn’t make anybody super happy and excited, you could actually submit, provide a donation to the foundation. It will go in this affordable housing fund that the foundation holds onto at some time in the future when the city has a specific project or specific need for the dollars to be used for affordable housing, we can draw on those dollars and use them for that particular purpose.
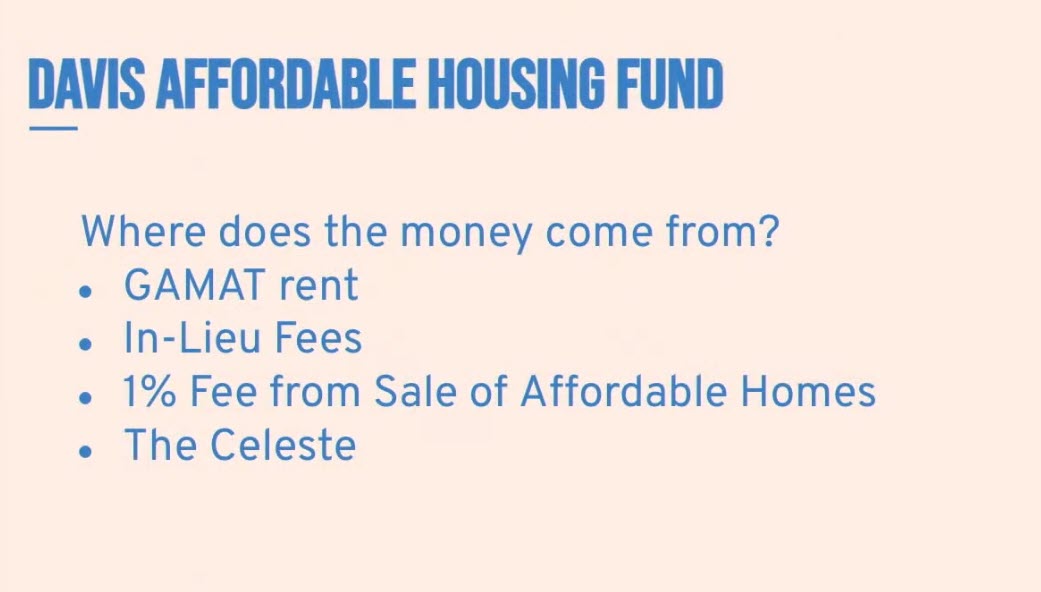
This is the very short list of where revenue comes from for that fund right now. So I’m going to translate what some of these things mean. The gamut, rent, the city happens to own about 20 single-family homes that are used for affordable single-family home rentals. Because the city owns the homes outright, we don’t have carrying costs on them and we’re able to use, or the majority of the rent that comes in from those homes we’re able to put into the affordable housing fund and use to seed the fund. It’s not $2 million a year, it’s about $150,000 a year give or take. So that’s one source. Another source is in lieu fees. So when we have a project that comes to the city, sometimes the council agrees, the developer proposes and the council agrees to allowing for in lieu fees. So instead of building a particular unit that’s an affordable unit, the developer will pay in lieu fees.
That is a feast or famine. If you’ve got a project coming in that the fund might get the in lieu fees, but if you don’t have any projects then you don’t get any in lieu fees and either way you don’t get any units. So it’s a mixed bag. It’s an option and it’s a toolbox, a tool in our toolbox, but it’s not, doesn’t create a unit. The 1% fee from the sale of affordable homes. So Dana mentioned earlier that we do have, when I say the city doesn’t own them, they’re privately owned, but they have covenants and restrictions on them. So these affordable units, when they’re sold, the city works to bring a buyer to the seller. And if the city does that within a certain timeframe, then the city gets 1% of the fee. Somewhat like a real estate agent we’d get.
Again, those are we sell or we are involved in a handful of sales a year. So that’s not going to amount to hundreds of thousands of dollars, but $20,000 a year maybe. So it’s something. And then I put in the bullet here for the Celeste, that is a new apartment complex, an all market complex in South Davis and the council approved a new kind of scenario for us, an ongoing source of revenue for affordable housing. The project, once it is fully occupied and has been in place for a year, which it’s now about that time, a percentage of the rent will be provided to the city in every year as a payment in lieu of the actual units. So they don’t have any affordable units. That’s the downside. But the upside is we’ll have this ongoing contribution to the affordable housing fund and it will be a minimum of a hundred thousand dollars a year.
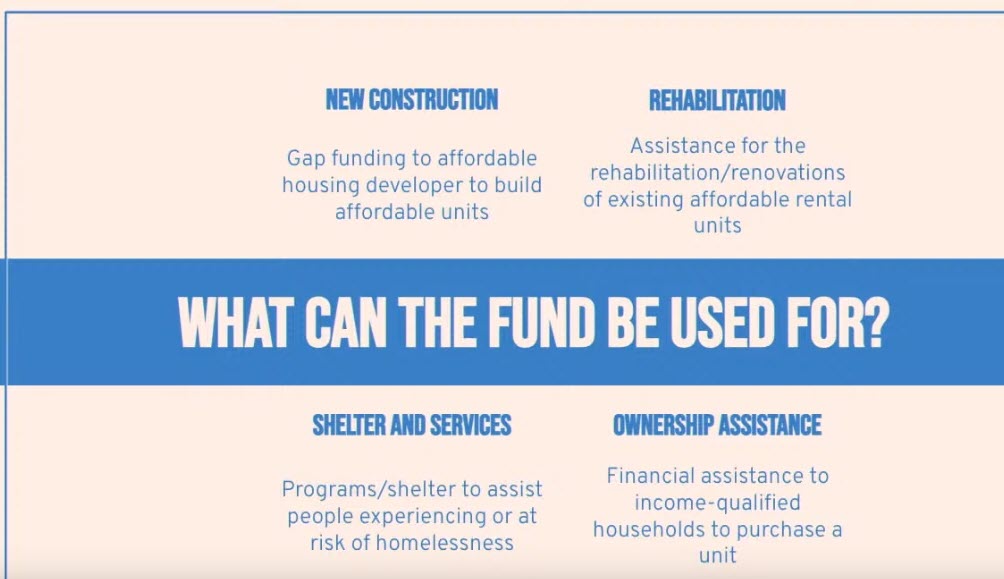
So we’re curious to see how that’s going to work. It hasn’t started yet, but that is a legal agreement that the developers engaged in with the city. So that’s where we get the funding. It’s not a lot and we’re still trying to look for additional options. So how do we use the funding? You’ve heard from several of the speakers this evening, different ways that we use the funding and it really is along a continuum and it really is up to the city and the community to decide what our priorities are. There are many more needs than there are dollars, and I don’t think that’s ever going to change. So we’re going to have to decide, do we want to spend more on homelessness services? Do we want to do down payment assistance programs? Do we want to do permanent supportive housing? Are we interested in tenant-based rental assistance? Do we want to provide funding to affordable developers like mutual housing to build new construction?
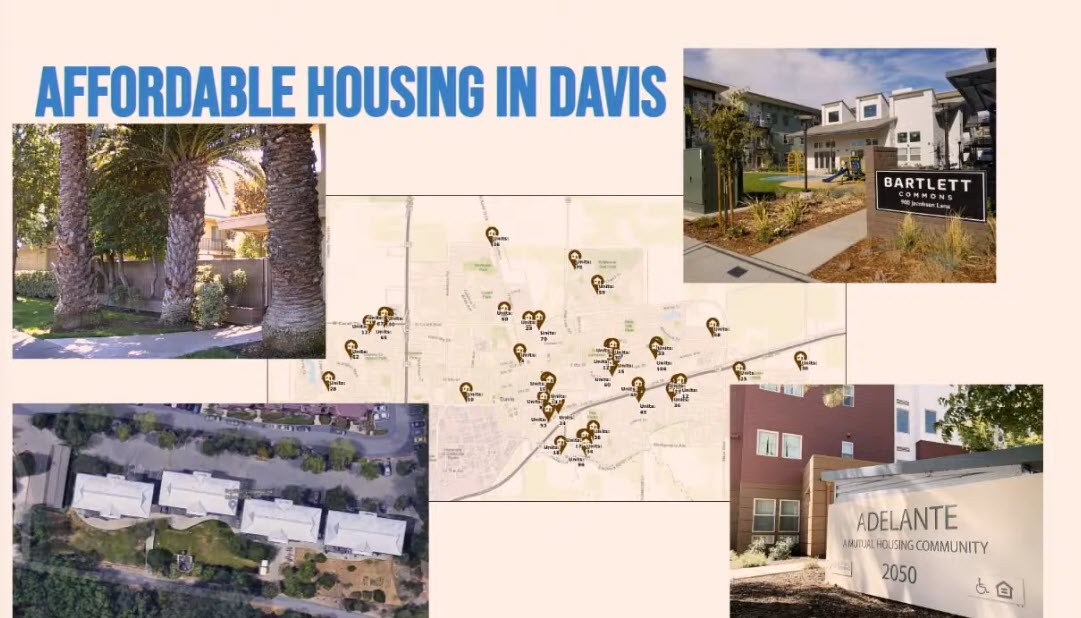
What is our priority? What are our policy objectives? Not an easy question and definitely not an easy answer. Go ahead and go to the next slide. I’ll finish up. I put this slide on here because I did just want to show that we have tried really hard in Davis to spread our affordable housing across all parts of the community. So this is slightly old map. It doesn’t have a couple of our newer projects on it, but there isn’t one part of the community that has all the affordable housing and another part that has none. We really have tried to make sure that affordable housing is integrated into the neighborhoods and is part of every portion of town. One of the things that I’ll mention that’s not specific to the Affordable Housing Fund, but is a critical part of making this happen is the city’s inclusionary housing policy. And so that means when a developer comes in with a proposal for a subdivision or some sort of residential project, that we require a portion of that project to be affordable. So right now the proportion of that or the percentage of that is 15% of the units for rental units must be affordable. Otherwise, the other options could be things like the in-lieu funds or potentially other scenarios, but because of that, affordable housing is intended to be part of each sub portion of the community not located in one particular spot.
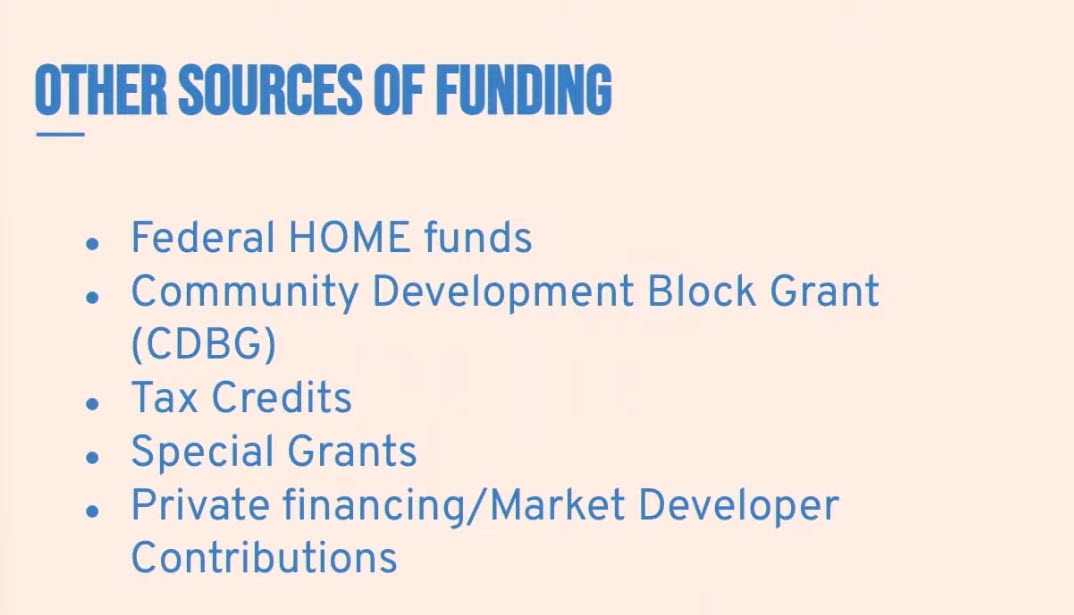
Roberto already commented on this, but it’s extremely complicated to put together an affordable housing project and the city has at its disposal, the affordable housing fund. We also use our home funds and our community development block grant, our CDBG funds, those are both federal sources of funding. We use those very heavily for affordable housing. Home can be used primarily for new construction. CDBG is often used for rehabilitation or renovation projects. But in addition, there are tax credits and special grants. There’s state funding, there’s private funding from developer other locations and it is a bit of a Tetris puzzle to piece it all together. So we do try to work as we can closely with our affordable housing development partners such as Mutual to package together different funding sources. One of the things I do want to mention that I think is important for this community is that most of the federal funding sources that we do have available do not allow funding for traditional students. So if when I say traditional student, somebody who is single has no children, goes from high school to university is low income or doesn’t have an income, they are generally not considered or not allowed to be low income in terms of the projects that are funded by federal funding. So we have to use other sources of funding if we’re looking at that particular population, which for our community is a large percentage of our population.

It is worth noting that the sole focus of Kelly’s presentation was on Affordable Housing. So that means:
— Beginning with Rev. Connie Simon affordable housing was front and center, but market rate housing was never even mentioned much less discussed.
— Roberto followed Rev. Connie and other than one brief aside, he too never mentioned market rate housing.
— Following Roberto, Dana Bailey never mentioned market rate housing (or even housing affordability given her very appropriate and thorough focus on homelessness),
— Then Bill Pride continued the trend by never mentioning market rate housing,
— Followed by Judy Eniss, who never mentioned market rate housing,
— Robb Davis who also never mentioned market rate housing, and
— Every one of Ximena Diez-Jackson’s audio clips from members of our community were about the affordability of housing.
It wasn’t until Georgina Valencia that market rate housing entered the discussion.
— Then Kelly Stachowicz resumed the pattern of never mentioning market rate housing.
So, once again that leaves me with the unanswered question, “If eight out of the nine speakers up through Kelly were laser focused on housing affordability (both capital “A” affordable and small “a” affordable), then why are the developers not “showing empathy for their neighbors” (a beautiful, resonant invocation by Robb Davis), and coming forward with proposals for smaller square foot per unit housing that is affordable for the people in the Davis workforce who need affordable housing?”
I firmly believe that the lack of housing affordability in California is a society-level problem. Shouldn’t the solutions also be society-level? The State is playing Pontius Pilate and imposing an unfunded mandate on the individual Cities, Counties and communities. Shouldn’t we get behind a statewide affordable housing tax measure that can be used to help developers plan and build additional housing that is 100% affordable for the members of the workforce in Davis (and all California communities). That truly would show empathy for California neighbors.
What did you have in mind for the builders to do?
Cost of Constructing a Home
January 2, 2020
By Carmel Ford
NAHB Economics and Housing Policy Group
Introduction
Over the years, NAHB has periodically conducted “construction cost surveys” to collect information from builders on the various components that go into the sales price of a typical single-family home.
NAHB’s most recent Construction Cost survey (conducted in the fall of 2019) shows that, on average, 61.1 percent of the sales price goes to construction costs and 18.5 percent to finished lot costs.
On average, builder profit is 9.1 percent of the sales price.
https://www.nahb.org/-/media/8F04D7F6EAA34DBF8867D7C3385D2977.ashx
Don, the chair of the Planning Commission provided the answer to your question in an official comment from the dais during a Planning Commission meeting. His comment was as follows, “Affordability by design, is elusive at best. Affordability by size is the only way to build truly affordable homes.” Following that advice, instead of designing 3,000 square foot homes with large lots, build 1,500 square foot homes with considerably smaller lots. The 61.1% and 18.5% percentages you have quoted will still apply … generating a healthy profit for the developers.
With that said, do you believe the homes that were built in Davis over the past 10 years were “On average …” sized homes? … which is reported to be 1,860 square feet in California.
Average
Median
Rank
square feet
Price
State
1
2,800
$259.05
Utah
2
2,464
$279.55
Colorado
3
2,311
$286.85
Idaho
4
2,285
$189.87
Wyoming
5
2,277
$223.75
Delaware
6
2,262
$180.61
Georgia
7
2,207
$234.53
Maryland
8
2,200
$324.53
Montana
9
2,190
$139.12
North Dakota
10
2,185
$335.73
Washington
11
2,170
$194.87
Texas
12
2,158
$238.21
Connecticut
13
2,157
$213.79
Tennessee
14
2,152
$213.62
North Carolina
15
2,146
$155.82
Alabama
16
2,123
$181.72
South Carolina
17
2,105
$209.76
Virginia
18
2,087
$182.27
New Mexico
19
2,065
$130.46
Mississippi
20
2,060
$281.85
Nevada
21
2,049
$269.26
Arizona
22
2,045
$180.82
Pennsylvania
23
2,026
$197.46
Minnesota
24
2,020
$135.92
Kansas
25
2,016
$169.26
Nebraska
26
2,011
$153.55
Indiana
27
2,000
$232.92
Vermont
28
1,960
$265.08
Florida
29
1,955
$149.65
Louisiana
30
1,953
$155.86
Kentucky
31
1,946
$307.86
Oregon
32
1,941
$167.50
Oklahoma
33
1,934
$267.29
New Hampshire
34
1,915
$181.86
South Dakota
35
1,913
$270.42
Rhode Island
36
1,910
$227.69
Alaska
37
1,860
$442.70
California
38
1,860
$134.74
Arkansas
39
1,848
$162.46
Missouri
40
1,822
$185.48
Wisconsin
41
1,803
$146.77
Ohio
42
1,800
$398.77
Massachusetts
43
1,753
$266.77
New Jersey
44
1,752
$119.56
West Virginia
45
1,726
$178.57
Michigan
46
1,700
$181.70
Illinois
47
1,680
$231.96
Maine
48
1,623
$187.99
Iowa
49
1,490
$421.49
New York
50
1,164
$743.86
Hawaii
The table above did not keep its physical integrity of rows. For each state the first number is the Rank. The second number is average square feet of a home in that state. The third number is the median Price in Dollars per Square Foot.
With that clarification made. It is worth reiterating Tim Keller’s often said remarks here, that the affordability of new single family detached homes is considerably less than the affordability of “Missing Middle” attached homes.
Matt – do you think maybe one reason why they focused on affordable housing had to do with who the speakers were and what they specifically were asked to speak about?
I gleaned something else from Kelly’s talk, but I’ll save it for a future column.
David, just as there are eight million stories in the naked city, there are a myriad oif reasons why each speaker chose what they spoke about. The reasons why they made those choices do not change in any way what they said and showed. I know for a fact that at least two of the speakers changed the content of their respective presentations just before the event began. The organizers did not ask them to make those changes, they made those changes unilaterally on their own.
I suspect that most of the speakers spoke on what they were comfortable with, rather than anything specific that the organizers asked them to talk about.
Further, if this event were one of a series of events, then your point might have merit, with the plan being for one or more of the follow-up events to cover market-rate housing. However, no such follow-up events are planned. This “series of events” is a series of one, and one alone. So deferring a topic to a future meeting that is never expected to happen would be foolish at best.
Times yours.
Matt: I didn’t ask, but this is what Bapu said: “I was asked to talk about the housing trust fund and the affordable housing fund” and given that the entire focus of the evening and the major push by the group has been the affordable housing trust fund, I suspect otherwise. Not sure this point is really worth spending much time on to be honest.
A few others who spoke also now told me they were specifically asked to talk about affordable housing AND they pointed out that the event was billed as a discussion on affordable housing.
David, were they specifically asked to talk about affordable housing or housing affordability?
Quoting you from your May 16th article announcing the Forum, “As Georgina Valencia, one of the organizers of the event noted last week, the forum will answer the questions “why should we care about housing?” and “do we have enough housing?
And quoting Interfaith Housing Justice Davis (IHJD) from their May 9th announcement of the Forum, “IHJD urges all community members to participate in shaping the future of housing in Davis.”
The lack of sufficient housing in Davis is not a State or society problem, it is exclusively due to the decisions of Davis voters. The empathy that is lacking is on the part of Davis voters who continue to support Measure J and oppose all new housing (or at least those projects that are not deemed ‘perfect’). You cannot increase affordable housing in town unless you are willing to approve new housing in general. Developers are not running charities.
That is your personal opinion Mark. My personal opinion is different than yours. Opinions are like sphincters. Everyone has one.
No, Matt, it is a fact. We have failed to build sufficient housing.
That is clear, since all you have done lately is blame others for our housing shortage. For a long time according to you, the University was at fault, now you have expanded that to the State and society at large, all the time failing to look in your own mirror while considering your obvious lack of empathy.
Mark, you need to check your facts.
1) From 2013 to 2022, California’s local governments (who control the home permitting process) approved 2.6 new housing units per 100 residents
2) From 2013 to 2022, the City of Davis reported to the State that it issued building permits for a total of 1,837 units.
3) 1,837 units at a rate of 2.6 units per 100 residents is the statewide rate for a city with a population of 70,653 residents. During that period the City’s US Census population was between 65,622 and 66,850.
Bottom-line, Davis built more housing units during that period than the statewide average.
Further, it is a well known fact that the imbalance between housing supply and housing demand are the result of the strong growth of the California economy … growth that has created hundreds of thousands of new jobs statewide, and the creation of new jobs increases demand for housing.
That is the California statewide story. What is the City of Davis job growth story? From the US Census On The Map Reports the number of jobs in the City of Davis in 2004 was 14,245. Between 2004 and 2016 the number fluctuated between 14,061 and 14,993. Between 2017 the number has fluctuated between 15,115 and 15,984, with more than half of the increase coming in hospital workers. That is a 12% increase in 18 years … considerably less than 1% per year at the same time that the housing units grew at over 2.6% per year. Those are the facts.
Matt:
If, as you claim, we have built sufficient housing, then how can it be that there is a long standing shortage of housing in town? Your thousands of words posted on this subject are simply your nonsense attempt to justify the selfishness of anti-development fanatics.
The housing shortage in Davis exists, and has existed for decades, directly due to our failure to build sufficient housing. Deny it all you want, your position will still add up to nonsense, no matter how many words you type.
Garbage in garbage out. Matt’s statistics are meaningless because they fail to incorporate the impact a growing UC campus lying adjacent to the City of Davis has on the local housing market. I recently read where UCD has 40,000 students and 20,000 employees. I wonder how many additional jobs, not considered in Matt’s analysis, were added during the timeframe he looked at?
Mark, what the numbers illustrate is that the housing shortage in California and the housing shortage in Davis closely parallel one another. It is a societal problem brought on by the success of the California economy (and the very good California climate).
What the numbers also show is that the Davis economy during that same period has been moribund (at best). You have often expressed your frustration with the Davis economy, so I know you agree with that fact.
So, the housing shortage … the existence of more demand for housing than there is supply of housing … is an economic and societal reality that has been and continues to be due to forces from outside the Davis City Limits.
Where is the demand for housing in Davis coming from?
(1) Wealthy investors looking to reap strong profits from the housing rental market
(2) Current Bay Area homeowners, who are capitalizing on pandemic-accelerated changes in the employment marketplace … they can work remotely from home.
(3) The over 250,000 living UCD alumni who have accumulated enough wealth to be able to afford to move back to Davis because it is emotionally a “return to their roots”
(4) Some of the 15,115 people that the US Census shows are employed within the city limits of Davis (11,081 of the 15,115 are classified by the Census as “Primary Jobs” with the remaining 4,834 being part-time jobs
(5) Some of the 11,000 to 16,000 Davis campus employees of UCD (different UCD employment reports show different numbers in that range). A March 2023 report I received directly from UCD’s Department of Budget and Institutional Analysis is on the low end of that range (approximately 11,000) with only 3,597 of the 11,000+ living in the City of Davis.
(6) Some of the 30,0000 students enrolled at the Davis campus
(7) Retirees who want to be in Davis to be near their family … or just because Davis is an excellent (and expanding in numbers) retirement community.
There may be other categories, but those are the biggies. How many of them are “needs”? How many of them are simply “wants”?
That doesn’t matter.
That doesn’t matter.
Correct. The state is mandating Davis build a certain amount of housing and willing to enforce those mandates with litigation.
Ron, UCD reported that in 2013 there were 21,965 jobs/employees on all its campuses. The same report shows 7,142 of those jobs/employees at the Medical Center. That leaves 14,823 jobs/employees at all the other campuses, which is predominantly at the Davis Campus. The same report shows numbers for each year up through 2021, with 2021 showing 24,977 jobs/employees on all its campuses and 9,224 of those jobs/employees at the Medical Center. That leaves 15,753 jobs/employees at all the other campuses.
The change therefore is 2,082 jobs/employees at the Med Center and 930 jobs/employees at all the other campuses.
At all the other campuses, the two categories that had the most change were the non-academic managers up 46% (up 150 jobs) and non-academic senior professionals up 275% (up 592 jobs). Clinical Faculty, which includes both the Med Center and Vet School was up 41% (up 262 jobs), is included in the Davis Campus numbers and not in the Med Center numbers, and it is not possible to distinguish between the Med School and Vet School numbers. So the 930 increase on all the other campuses other than the Med Center would be affected by the change in Med School Faculty.
Hope that helps. If you want to see the screen print of the UCD report, just l;et me know and I will e-mail it to you.
Matt asked
Don Responded
Don, are you really saying (with a straight face) that there is no meaningful difference between “needs” and “wants.” To illustrate how they are different let’s use your question about the soon-to-be proposed Additional Tax Measure that Council has said they are planning to put on the November Ballot. One of the key questions that has been asked about that Tax Measure is how big it is going to be … and/or how big it should be?
The last time that City Council considered an incremental Tax Measure it convened an ad hoc citizens committee/task force to assess the characteristics of the various financial “needs” that they were being asked for by various citizens and/or stakeholders in the community. What the committe/task force quickly saw was that some of the “needs” on the list did not have the level of urgency to qualify as “needs” but rather were at best “wants” and some of those “wants” were even less urgent (and valuable to the community) so they went into a third category, which was “nice to haves.”
You go through this same process when you are considering your plants and/or plan supplies orders at Redwood Barn. Bottom-line, the differences between “needs” and “wants” and “nice to haves” truly does matter.