 John Munn on Wednesday became the first candidate to turn in paperwork for the Davis City Council election.
Thus far, he has declined an interview, but late Wednesday he put out a packet of information that we will publish in its entirety here for public consumption.
In his note, he writes, “Attached are copies of my candidate statement, that lays out my basic reasons for running, and my nomination signatures list. Both the candidate statement and the nomination signatures are matters of public record, so I know that this only makes it more convenient to see what you could ask for from the City Clerk.”
He adds, “My nomination signatures were not based on political connections. Instead, they come from friends, neighbors, and associates who reach into the community in different ways and show a wide range of support. These are my neighbors, who were still willing to sign after many years of putting up with my home projects, friends with whom I have shared time on personal and community activities, co-workers who know what I can do, fellow board members and staff members who are familiar with my School Board service, and supporters who see the need for more realistic financial management by the City Council.”
He also included “a summary spreadsheet showing the progression of annual city services costs from 1980 through the end of the current, new rate structure (I have it set to print the first 9 columns). And I have included a description of how these numbers were determined and what I think they mean. The summary comes from a bill-by-bill calculation sheet put together from my own city services bills, but assuming near-average water use for single family residences.”
Candidate Statement
Davis needs city leaders who recognize the importance of fiscal sustainability and affordability. I have practical experience with soil and water management and education in engineering that provide perspective for making realistic judgments about facility and maintenance needs and costs. My service on the Davis School Board demonstrates an ability to work with others.
City services costs in Davis are out of control. Recent changes in water rates will increase annual costs for a typical single family residence by more than 300%, from about $510 to $2,100. Any shortfalls from projected revenue will cause rates to go even higher. The total cost of city services for this home have crept up by 11% during the past five years and are now scheduled to rise by more than 100% percent over the next five years to nearly $3,400 annually.
The City is also proposing to use new sales and parcel taxes to collect millions of dollars for postponed street repairs and other maintenance work. This growth in fees and taxes is not sustainable. I want to balance spending with available revenue, and ask for your vote to keep Davis affordable for all residents.
Nomination Signatures Supporting John Munn for Davis City Council
March 5, 2014
Vic Bucher*, Clay Brandow, Brooke Brandow, Jim Smith, Pam Nieberg, Pam Gunnell, Michael Bartolic, Joan Sallee, Tom Sallee, Shelley Munn, David Murphy, Robbie Murphy, Jim Stevens, Glenn Holderreed, John Youmans, Alzada Knickerbocker, Dennis Lindsay, Milt Blackman, Debbie Fung, Manny Carbahal, Eric Thompson, Gayle Thompson, Les Portello, Jim Leonard, Don Price, Nancy Price, Dorothy Morrissey, Dick Morrissey, Mark Siegler, Michael Harrington.
* In order that signatures were received
[divider]
City Services Costs
By John Munn
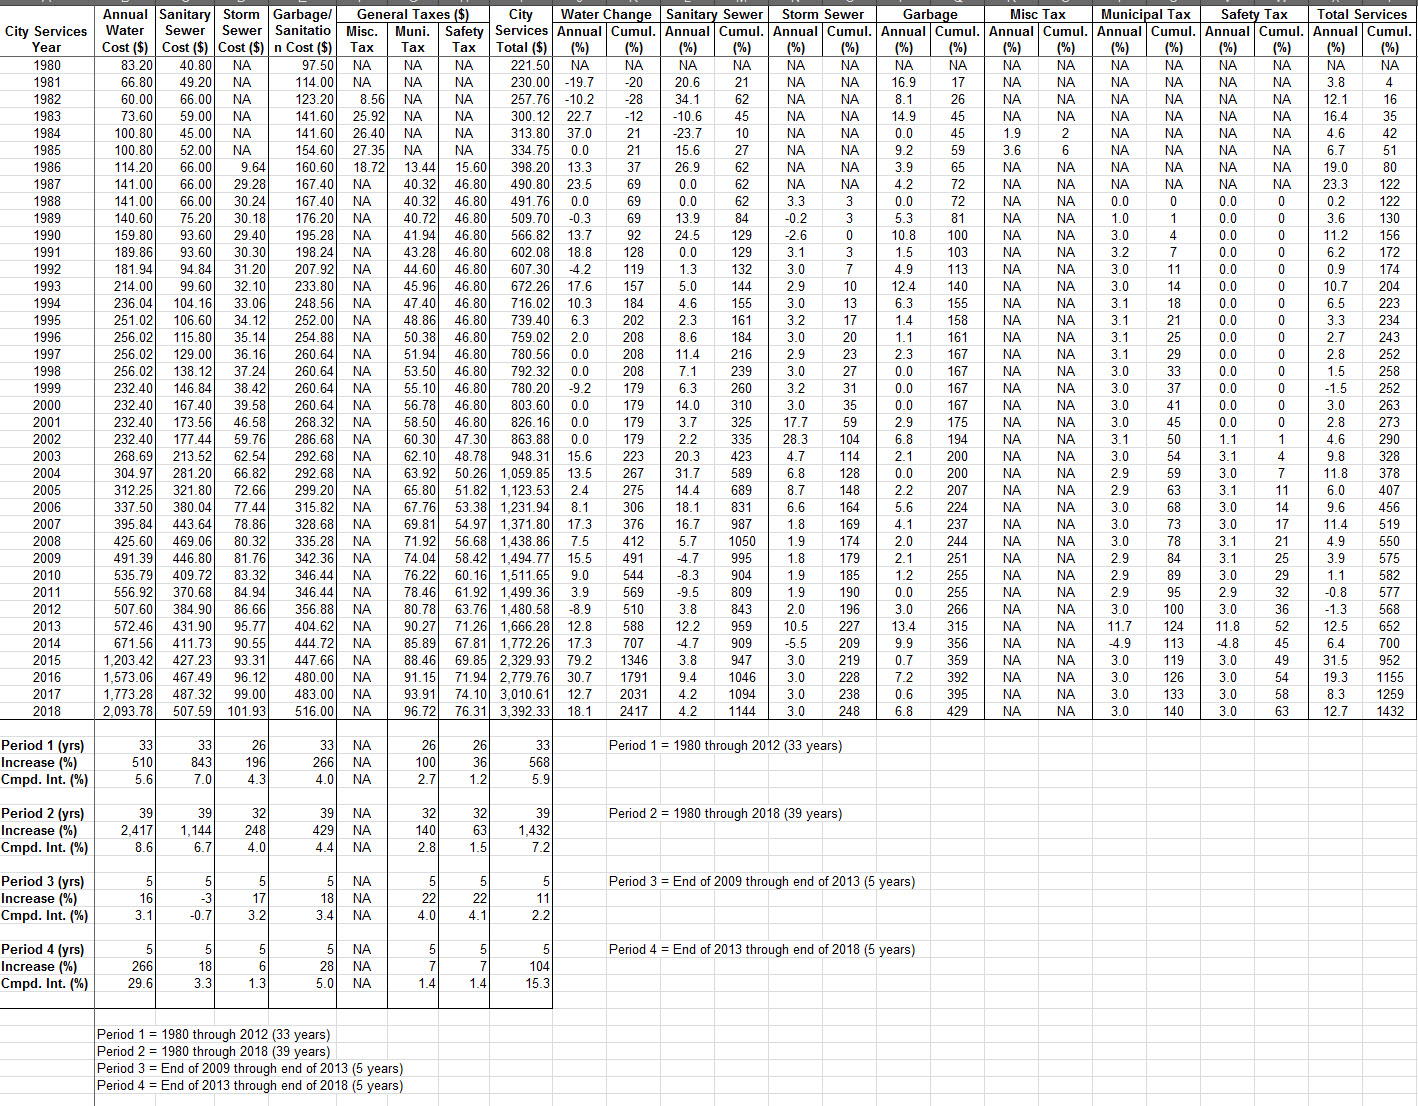
Enclosed is a summary of Davis City Services costs from January of 1980 through December of 2018 for single family residences (multi-unit and commercial parcels have different rate structures). This includes cost projections for 2014 through 2018 based on recent rate increases for water and historic rate increases for other services. Percentage increases in annual totals for different service categories are listed below for periods extending from 1980 through 2012 (33 years), from 1980 through 2018 (39 years), over the past five years (end of 2009 through end of 2013), and projections for the next five years (end of 2013 through the end of 2018).
Beginning water costs used in this summary are based on the flat rates used from 1980 through 1998. Starting in January of 1999, after water meters were installed, water charges are based on volume used. In May of 2003, a second tier was added for bi-monthly use above 36 ccf (hundred cubic feet). Then a third tier was added for bi-monthly use above 47 ccf in August of 2013. Both flat and tiered rates have been changed (almost always increased) over time.
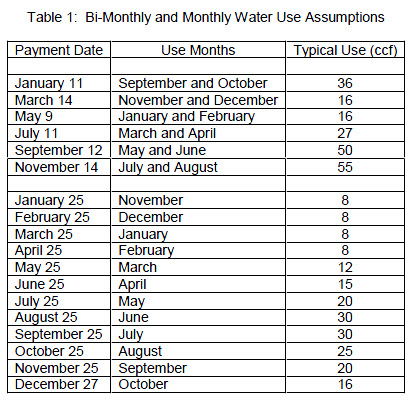
The volume of water used for consumption based charges is based on seasonally variable monthly, and equivalent bi-monthly, amounts for a typical single family residence, as shown in Table 1 below. These volumes, which resulted in a slightly reduced water charge compared to flat rates, have been held constant over the entire consumption based period so that costs can be compared between years. They are somewhat higher than current average use, but are less than average use during most of the summary period. The objective has been to base water costs on single family residence use that includes summer watering of trees, gardens, and lawns.
The Sewer System charge was split into Sanitary and Storm drain charges in September of 1986. Then, starting in September of 2009, sanitary sewer costs were changed from a flat rate to an amount based on average water use during winter months. A constant value of 8 ccf, that is near the current winter average has been used to calculate the volume based sanitary sewer cost.
Using these assumptions, the percentage increases in annual city service costs from 1980 through 2012 (prior to the most recent rate changes) have been:
– Water = 510%
– Sewer System (sanitary + storm) = 1,056%
– Garbage/Sanitation = 266%
– General Taxes (since first established in September of 1982) = 458%
– Total of all city services (the bill amount) = 568% (with an annual compound rate, or APR, of nearly 6%)
Percentage increases in annual city service costs from 1980 through 2018 are projected to be:
– Water = 2,417% (an increase of more than 25 times*)
– Sewer System (sanitary + storm) = 1,394%
– Garbage/Sanitation = 429%
– General Taxes (since first established in September of 1982) = 568%
– Total of all city services (the bill amount) = 1,432% (with an annual compound rate, or APR, ofmore than 7%)
Percentage increases in annual city service costs for the past 5 years, from 2009 through 2013 were:
– Water = 16%
– Sewer System (sanitary + storm) = -0.2% (an actual decrease in rates)
– Garbage/Sanitation = 18%
– General Taxes (since first established in September of 1982) = 22%
– Total of all city services (the bill amount) = 11% (with an annual compound rate, or APR, of just over 2%)
Davis City Services Costs Summary Page 2
And the projected increase over the next 5 years (from the end of 2013 through 2018) will be:
– Water = 266% (an increase of more than three times*)
– Sewer System (sanitary + storm) = 16%
– Garbage/Sanitation = 28%
– General Taxes (since first established in September of 1982) = 7%
– Total of all city services (the bill amount) = 104% (which gives an overall annual compound rate, or APR, of more than 15%)
The effect of initial costs (which start small and are larger at the end of 2013) on the calculation of percentages needs to be kept in mind when comparing the numbers given above. This consideration, however, does not apply to the compounded rate of increase given for the total of all city services or to comparison of the actual costs.
As described above, determining city service charges over time is complicated by adding sub-categories and changes in the water bill and the sanitary sewer bill. In addition, the General Taxes category started with a “Misc.” tax in September 1982 and was changed to separate “Municipal” and “Safety” taxes in
September of 1986. There is also some adjustment for parcel size included in most of the service charges, which further complicates parcel comparisons.
These calculations show that, for the example used here, city services costs for single family homes has increased steadily from an annual total of $221.50 (starting at $36.80 per month) in 1980 to approximately $1,666 per year at the end of 2013. This is an increase of more than $1,400 in annual city services costs before the recent, very large increase in water rates. Now, we are looking at increasing the annual cost of city services from $1,666 in 2013 to $3,392 at the end of 2018, for an additional increase of $1,726.
This means that city service costs are scheduled to go up more under the latest rate increase than they did over all the years since 1980. Most of this increase is in the cost of water, which is going to more than triple. And these calculations do not include any water use that reaches the new, extremely expensive tier 3 rates. Additionally, the city is assuming another doubling of water revenue after 2018 to pay for surface water system project costs, so we are not done with higher water rates. Rates may be further increased if large irrigation users switch to using their own wells, leaving remaining ratepayers to cover existing fixed costs.
Before going farther down this road, we need to determine how much the residents of Davis can actually afford to pay for city services, and what effects such large cost increases will do to the character of our community.
John Munn
3/5/2014
________
* A 100% increase doubles the initial amount, a 200% increase is equivalent to three times the initial amount, and a 300% increase requires that the final value be 4 times larger than the initial amount. This is demonstrated by the following examples of initial and final value percentage calculations: 100*(2-1)/1 = 100%, 100*(3-1)/1 = 200%, and 100*(4-1)/1 = 300%.


Interesting list of names on his nomination. Fiscal issues can bring strange bedfellows together!
Looks like the usual suspects who are against the water project. Surprised to see Manny Carbahal on the list, tho. Isn’t he Krovoza’s treasurer?
While what you call the usual suspects are there, there are also a good number of prominent business leaders, it is a pretty broad coalition that goes far beyond what you describe.
He certainly has my ear even though I supported the water project.
anyone who believes that john munn is just a niche candidate after looking at that list of endorsements needs to re-think that notion. if i were a rochelle swanson supporter, which i might be, i’d be worried at this point.
I guess it must be tough to manage his water bill with his paltry $85,000 a year pension from the State of California.
Let’s stop the labeling. There is lots that could be said of the “usual suspects”/”machines” behind any one of the candidates and this could all be true to some degree or other ….ad nauseum . If any one chooses to read the initial endorsers of candidates or their growing endorsement lists, can figure it out and we can all do that analysis. And, frankly, it all depends on when you moved to Davis, what circles you “travel” in, etc. Do many who moved to Davis recently really know how Central Park was “saved,” by whom and what “usual suspects “endorsed that very very broad effort? Sometimes the labels are an easy tool to marginalize or defeat one or another candidate.
What we need is a campaign on the issues with facts, figures, and honest discussion..no hiding behind generalities or false promises.
I wonder what John Munn thinks about privatization of municipal services and resources. Or corporate personhood. Or a whole host of things I believe Nancy Price (based on her previous posts) adamantly opposes. My point in calling his supporters “the usual suspects who are against the water project” is that someone like Munn would not have the support he enjoys were it not for that one very specific set of issues.
“My point in calling his supporters “the usual suspects who are against the water project” is that someone like Munn would not have the support he enjoys were it not for that one very specific set of issues.”
let’s call a spade a spade. you’re speaking here about water. so of the list of people, how many would you characterize as supporting him for his view on water and how many would say probably are supporting him for entirely other reasons?
I wouldn’t equate a nomination signature with electoral support. There are plenty of folks in town who I like, but who I wouldn’t want to see on the City Council. I’d gladly sign their nomination petition and wish them luck, but I’d vote for someone else. In other words, I think nomination signatures indicate community connections, not necessarily endorsement for office.
G.G.: Munn would not have the support he enjoys were it not for that one very specific set of issues.
I disagree. True that Munn has been outspoken on some issues recently, but I find that his list of nominating signatures represents some depth of connection in his local public service, including the Sallee’s and the Murphy’s, going back to his tenure on the school board.
exactly. perfect example.