 by John Munn

Putting out details always runs the risk of making mistakes in public, and my summary of city services costs that was published in the Davis Vanguard on March 6 is a case in point – where the water supply fee part of the new consumption based fixed rate (CBFR) structure going into effect next year was calculated incorrectly for the 2015 through 2018 time period. Rates are still going up, but this correction does make a difference in reported water and total city services costs, and it needs to be fixed. My summary of costs and the following discussion have both been revised to include the corrected rate calculations and costs.
I want to thank Matt Williams, one of the developers of the CBFR system, for taking the time to check my numbers. Our cost estimates are still not the same, but it appears that remaining differences result from different assumptions. I read the Davis Municipal Code somewhat differently on when new rates should be applied to water use, but this does not make much difference in the bottom line results. I am also assuming somewhat higher summer water use for landscape irrigation. And I am including base rates for a one inch sized service connection that results in higher costs than the three-quarter inch connection used on many single family residences. Both the greater water use and the one inch connection have been maintained throughout my costs summary to provide consistent comparisons between different time periods and to give a sense of how increasing service costs are used to force changes in ratepayer behavior.
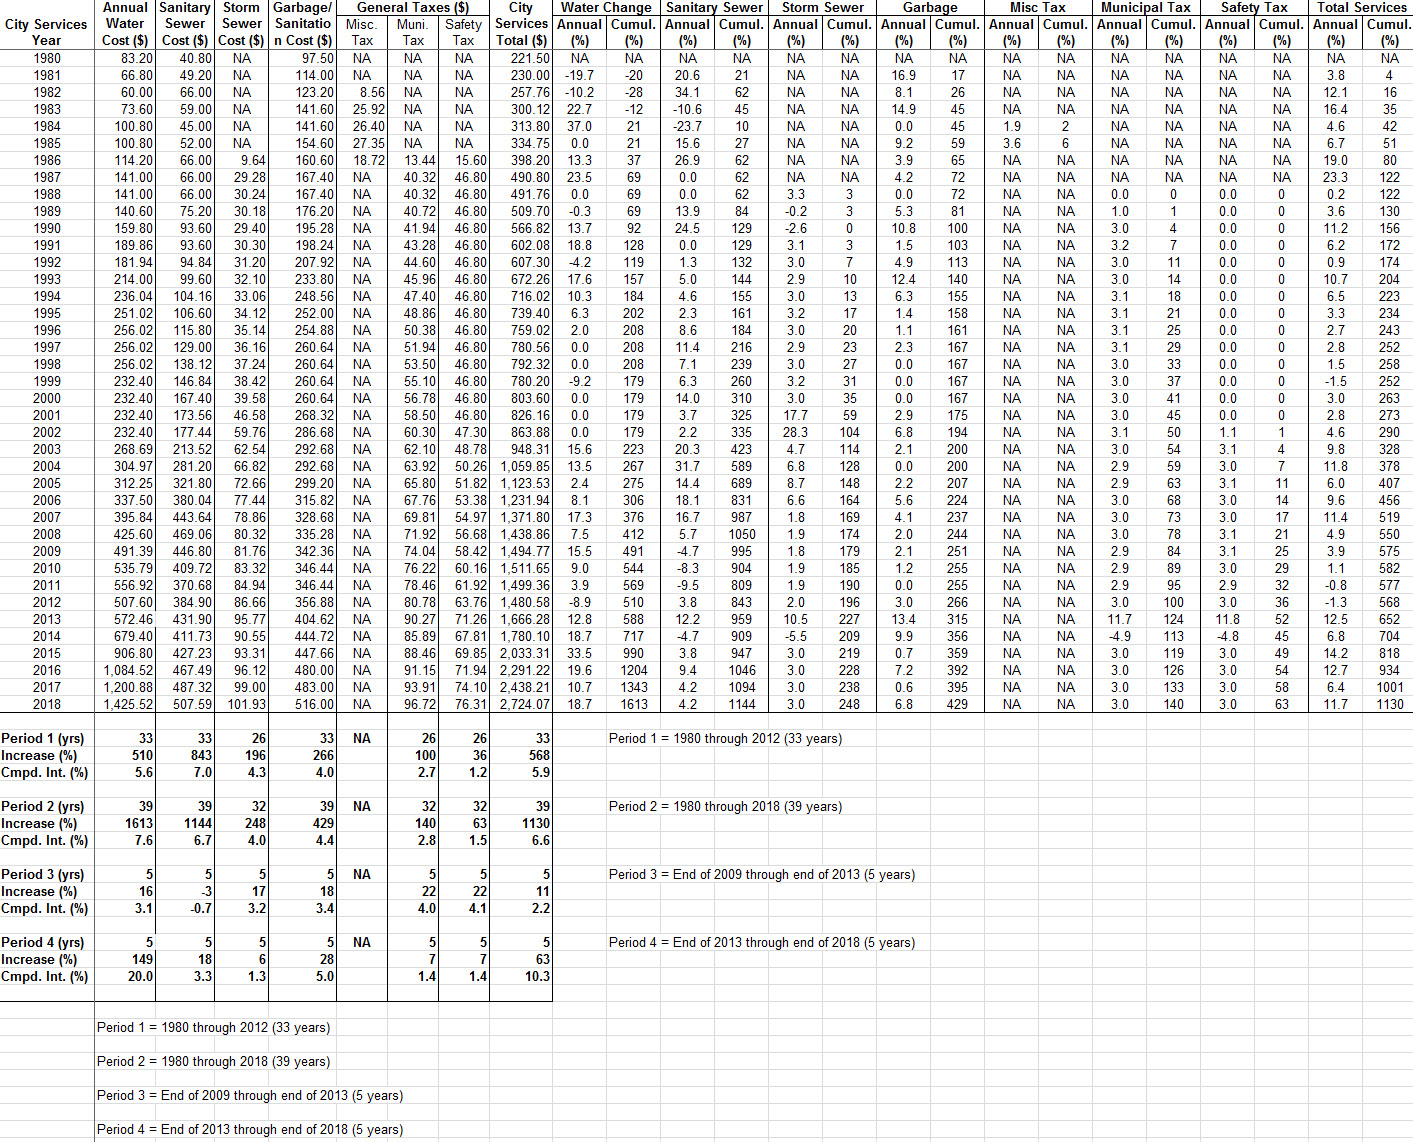
This summary covers Davis City Services costs from January of 1980 through December of 2018 for single family residences (Multi-unit and commercial parcel costs are calculated differently). Costs from 1980 through 2013 come from rates shown on my city service bills. Cost projections for 2014 through 2018 are based on recent rate increases for water and historic rate increases for other services. Percentage increases in annual totals for different service categories are listed below for periods extending from 1980 through 2012 (33 years), from 1980 through 2018 (39 years), over the past five years (end of 2009 through end of 2013), and projections for the next five years (end of 2013 through the end of 2018).
Initial water costs are based on the flat rates used from 1980 through 1998. Starting in January of 1999, after water meters were installed, water charges are based on volume used. In May of 2003, a second tier was added for bi-monthly use above 36 ccf (hundred cubic feet). Then a third tier was added for bimonthly use above 47 ccf in August of 2013 followed by the CBFR structure starting in 2015. Both flat and tiered rates have been changed (usually increased) over time.
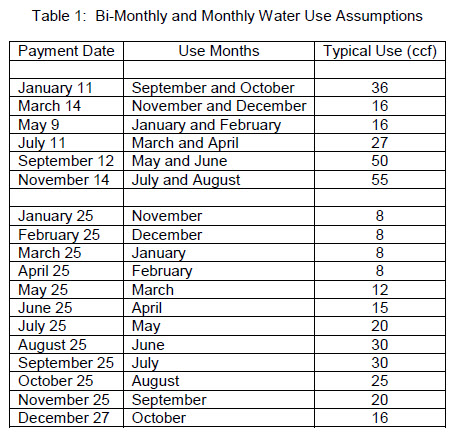
The volume of water used here assumes seasonally variable monthly, and equivalent bi-monthly, amounts for a single family residence, as shown in Table 1 below. These volumes, which resulted in a slightly reduced water charge compared to flat rates, have been held constant over the entire consumption based period so that costs can be compared between years. They are somewhat higher than current average use, but are less than average use during most of the summary period. The objective has been to base water costs on single family residence use that includes summer watering of trees, gardens, and lawns.
The Sewer System charge was split into Sanitary and Storm drain charges in September of 1986. Then, starting in September of 2009, sanitary sewer costs were changed from a flat rate to an amount based on average water use during winter months. A constant value of 8 ccf, that is near the current winter average has been used to calculate the volume based sanitary sewer cost.
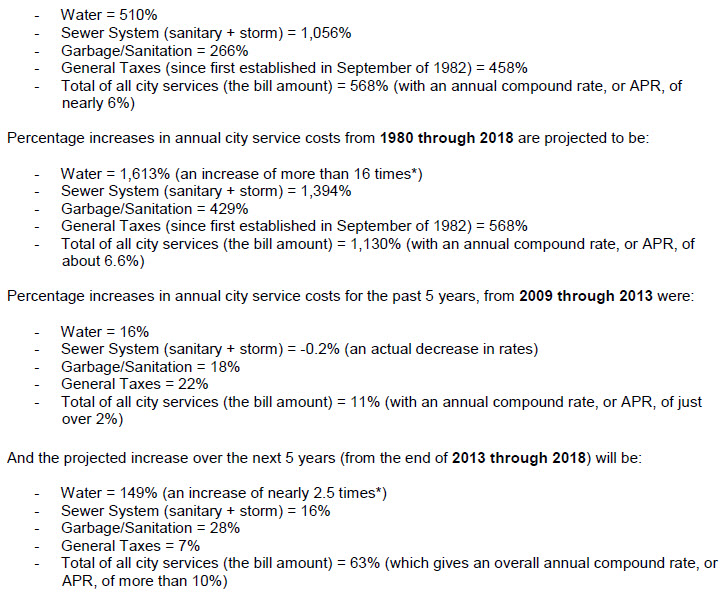
Using these assumptions, the percentage increases in annual city service costs from 1980 through 2012 (prior to the most recent rate changes) have been:
The effect of initial costs (which start small and are larger at the end of 2013) on the calculation of percentages needs to be kept in mind when comparing the numbers given above. This consideration, however, does not apply to the compounded rate of increase given for the total of all city services or to a comparison of actual costs in dollars.
As described above, determining city service charges over time is complicated by adding sub-categories and changes in the water bill and the sanitary sewer bill. In addition, the General Taxes category started with a “Misc.” tax in September 1982 and was changed to separate “Municipal” and “Safety” taxes in September of 1986. There are also differences based on system connection size and parcel size, which further complicates parcel comparisons.
These calculations show that, for the example used here, city services costs for single family homes has increased steadily from an annual total of $221.50 (starting at $36.80 per month) in 1980 to approximately $1,666 per year at the end of 2013. This is an increase of more than $1,400 in annual city services costs before the recent, large increase in water rates. Now, we are looking at increasing the annual cost of city services from $1,666 in 2013 to $2,724 at the end of 2018, for an additional increase of $1,058. This means that city service costs over the next five years are scheduled to go up by three-quarters of the total increase over the past 34 years (since 1980). Most of this increase is in the cost of water, which is going to more than double. And the city is assuming another doubling of water revenue after 2018 to pay for surface water system project costs, so we are not done with higher water rates. Rates may be further increased if large irrigation users switch to using their own wells, leaving remaining ratepayers to cover existing fixed costs, or if residents who can’t escape the city water system conserve more water than the city is assuming.
Before going farther down this road, we need to determine how much the residents of Davis can actually afford to pay for city services, and what effects such large cost increases will do to the character of our community.
* A 100% increase doubles the initial amount, a 200% increase is equivalent to three times the initial amount, and a 300% increase requires that the final value be 4 times larger than the initial amount. This is demonstrated by the following examples of initial and final value percentage calculations: 100*(2-1)/1 = 100%, 100*(3-1)/1 = 200%, and 100*(4-1)/1 = 300%.

But what was your house worth in 1980 $50,000 or $100,000? What is it worth today? 300, 400, or 500% more? What did a gallon of gas cost in 1980? I remember it at a $1.19 in the early 90’s. Today its 200% more.
You are cherry-picking your examples. Housing inflation was put into hyper-drive by government policy. Oil is commodity that is also hyper-inflated because of government policy… global government policy.
What was your phone bill in 1980 and what is it today? My bill is about 1000% higher with cell phone that didn’t even exist back then but the land line inflation alone is around 350%.
Fremontia wrote:
> What did a gallon of gas cost in 1980? I remember it at a $1.19 in the early 90′s.
In 1980-82 the price of gas spiked and was above $1.50 almost the whole time and super (they still sold super leaded gas in 1980) was pushing $2.00.
> What was your phone bill in 1980 and what is it today?
My “base” charges for Pacific Bell back in 1980 was $13.95 with free local calls but “out of the area” added about $20 on average and “long distance” was usually another $30 (a single call to Southern California could easily cost over $10).
> My bill is about 1000% higher with cell phone that didn’t
> even exist back then but the land line inflation alone is around 350%.
If you live in Davis where we have great coverage you don’t need a land line (I have never had one in Davis). If you still want a land line you should check out Ooma (www.ooma.com/) I have a lot of friends that rave about it
Comparing land-line phone charges… which is the only comparable since consumer cell phones did not exist until the late 1980s… the cost has not really increased more than the generate rate of inflation. Of course cell phone charges are very costly, but then you are talking about a smart phone with access to the Internet. That is worth every penny in my opinion.
A forty year ‘window’ to make a point… interesting… wonder what the numbers would have been, 1940-1980; 1950-1990; 1960-2000; etc. I dismiss this “analysis” as basically meaningless.
Forgot… 1930-1970.
Why? I think it is not meaningless. What period should we compare?
It is this last 40 year period where the cost of government has trended much higher than the general rate of inflation. And we are paying much more for municipal services primarily because of it.
Ok… let’s try apples and oranges… you look at just the costs, let’s look at the benefits. If we went back to the level of services 35-40 years ago, we’d have fewer parks and greenbelts, fewer traffic signals, etc. If we kept the same level of amenities and services that we had 35-40 years ago, over all of those years, it is unlikely that we would have the current problem.
We can easily reduce the cost of local government by letting greenbelts and parks go fallow.
We can easily eliminate all school levies by eliminating special programs.
I’m thinking there are a lot of the people who want the benefits (and have ‘demanded’ them), but they want to have them forl ess cost than before the benefits existed.
We also have many more taxpayers than we had 35-40 years ago so that extra revenue has to be factored in.
Assuming the services remained static, serving only the former number of taxpayers, you are correct. And, to the extent that the larger # of taxpayers came from additional development, increasing the inventory of roadways, water, sewer, and drainage systems, I can see where you believe the costs of maintaining and operating the increased infrastructure should been absorbed in the previous costs. Hell, everyone should deserve a refund, and the new taxpayers should be feted for reducing all our per taxpayer costs. I apologize for not figuring out the wisdom of your comments before.
No, not what I said at all, quit putting words into my mouth.
K. Was frustrated with your flip dismissal’ of my points.
You seem to get frustrated a lot. All that I was pointing out was that all those new developments, traffic lights, roads, infrastructure, etc. bring in more population increasing the tax base. We’re told it pencils out at first but in the long run it’s a fiscal negative for the city.
Here is the way I see it.
1. I won’t romanticize the past if you also do not romanticize the present. I agree that we have more amenities today, but I do not think it is as profound a difference as you make it out to be. The basic services are still the basic services. What we have increased is not so much tax-payer amenities as it is simply government service, operational and bureaucratic bloat.
2. We have city employees doing unnecessary work. It is for nice-to-have things that make a few residents feel warm and fuzzy… and I argue we should never have done in the first place… but we did when money was not as much as a concern.
3. What happen to economies of scale? For example, you mention that we have more stop lights and more parks, but then why don’t we see the cost per unit falling as we learn to be more efficient. That is how it is done in private industry… the reason Walmart can sell a gallon of pickles for $3 is economies of scale. We have exactly the opposite in city government. We have the cost per unit rising as we have added more units. You know it and I know it… our city employees generally work much less hard than they used to. They have much more paid time off. They have much more sick leave. They have many more regulations that prevents them from doing certain work without three of their coworkers standing around looking at them while they do the work.
3. The lion’s share of this hyper cost inflation is due to the increase in pay and benefits. We pay much more per unit of labor and get much less in return on a per unit of service basis.
4. Even if you want to come up with reasons to discount Munn’s numbers, you would never be able to get them to a point where they did not back his argument. The fact is that the cost of our city services on a per-unit basis has exceeded the rate of inflation by an order of magnitude. And 55 year old retired government worker neighbor can tell you why.
Can you provide examples of services you consider “nice-to-have”.
I’ll give you at least two, off the top. Bike -Ped coordinator (which has been re-named, I believe), and Open Space Manager.
Does Davis really need to pay a full time “Recycling Coordinator” and “Waste Management Supervisor”?
I’m pretty sure that people in Davis will still recycle and Davis Waste will still pick up the trash without these people (who I’m sure are very nice and do a good job) on the city payroll.
Police ombudsman can go too.
Why? That’s a position that has greatly reduced the number of lawsuits faced by the city.
1. Somewhat agree, but over the last 35 years, parks, open space, other infrastructure maintained, per resident, has grown.
2. Definitely agree.
3. Economies of scale… not quite correct… like roads, traffic are subject to the need for maintenance, repair, etc., particularly for detection and controllers. Look at where much of he attrition has come in city forces – road/striping crews, and electricians. Most of the problems with signals today is damaged detectors, and out-dated/failing controllers. No money for those for years.
From folks I’ve talked to on city staff, the public, per “unit” demands more attention today than years ago. That consumes a lot of time and effort that could otherwise be use for actual work on the public’s behalf. Not much data is available about ‘costs per unit of service’. And, ironically, to develop that data would require a whole bunch of new effort, that would not produce ‘product’, just information.
4. Notice that Munn’s figures look favorably on the relative steady, lower rates for solid waste. DWR didn’t have the history of deferred maintenance anywhere near the extent that that occurred in the other City utilities (in order to “save money”). As to employee compensation, the biggest ‘drivers’ in costs in recent years was playing ‘catch-up’ on the failure of the City to fully fund benefits when they were accrued (pensions and OPEB), increases in medical coverage costs. Yeah, the big raises in certain groups and changes in pension formulas didn’t help, but the basic problem existed BEFORE the changes in pension formulas. Certainly exacerbated the problems, but the underlying problem goes back before that, when the City paid zero (and/or very low %) for its share of pension costs due to great PERS investment results, and made the decision to use the money ‘saved’ to expand those ‘feel-good’ programs.
It is not a real simple problem. The answer is unlikely to be simple, unless one wishes to be ‘draconian’. Even then…
Its all absurd. Here is a guy who sued the city because the carrying costs of his house for city services are a few thousand a year. With a 1980 tax base he is paying less in mortgage, taxes, fees and assessments than most young working families pay just for their mortgage. Throw in that he has a nice pension with medical benefits and Medicare it seems he should easily be able to afford these costs. Perhaps its the inflation that he just can’t grasp or perhaps its that he paid too little for water for too many years because Davis foolishly didn’t invest for its future water needs until most recently. Or perhaps he truly can’t afford living in Davis. I don’t know but it sure seems like sour grapes to me.
he sued the city because he believed – perhaps correctly – that the rates passed violated the constitution. you are assuming that it’s because of the costs, what evidence do you have?
Fremontia wrote:
> he is paying less in mortgage, taxes, fees and assessments than
> most young working families pay just for their mortgage.
How do you know what is mortgage is? Did he tell you?
Many people that have owned for a long time have refinanced and have massive mortgages…
That is possible. I forgot that he also gets Social Security in addition to his Calpers pension.
But, if they are in the same house (have no idea if this applies to the candidate) they pay much lower property tax. Big mortgages, @ low interest rates just means they re-allocated their assets.
If the City issued financial information and then issued a correction or an update, John Munn and his friends make allegations of dishonesty and fraud by the City. However, it is framed as a merely an error based on a difference in “assumptions” when John does this. Remember this, John, going forward with your campaign and your lawsuit. I certainly will.
All I can say, John, is that you should hire a professional to help you adjust how much water you are using to irrigate your yard. 30 ccf per month? 50 ccf? I am going to make the assumption that you are watering too much and could do better to conserve without any adverse affect to your yard. Once the weather warms and you turn on your sprinklers, your water use should be consistent month to month.
This just solidifies my feeling that the opposition is upper middle class residents who want low income residents to pay more to subsidize the larger system that’s required to meet their larger water demands.
If you’re watering correctly, your water use should go up steadily until July, level off, and then taper off from September until the rainy season.
OK. I stand corrected on the pattern. I still suspect that he is watering more than actually needed or his landscaping is not ideal for this climate.
I appreciate Mr Munn laying out his analysis of the growth in costs of municipal services over the 33 year period since 1980. We need to have a conversation about these issues and address cost containment to the extent possible. However, I have several concerns with the data as presented, as well as some testable hypotheses about what might be driving the costs Mr. Munn has presented.
An initial concern is that some of the costs presented in the large table above are consumption-dependent — meaning costs will go up if more is consumed. This is certainly the case for water. What is not clear from the historical presentation is whether the costs presented represent level consumption or increased/decreased consumption. It is difficult to analyze cost growth without this information. For the purposes of this comment I will assume level consumption (and analyze the data further offline to confirm that that assumption was correct).
A second issue, raised by some posts here, concerns adjusting costs for inflation. It is standard practice and important to adjust nominal costs for inflation, but that does not appear to have been done here. This is important because Mr Munn reports total city services going up 568% from 1980-2013 (5.9% per year on average). If you adjust his figures for inflation (using BLS CPI) the increase is 140% or 2.65% per year on average. This indicates that city service costs are growing faster than inflation (though not as fast as the unadjusted numbers would indicate) and this should be a concern.
What is driving this faster than inflation growth in the cost of city services (again, assuming that water consumption is steady in Mr Munn’s numbers)? I would propose three hypothesized drivers:
1. More stringent existing regulatory requirements, higher permitting costs for solid waste, new water/wastewater discharge requirements, new public health water quality requirements, etc. imposed by state or federal agencies could drive some of the cost growth. I know we are, today, facing more stringent requirements and higher costs across the board but I cannot say if and how they contribute to faster than inflation growth.
2. Faster than inflation costs of critical maintenance inputs (things like asphalt, concrete, steel, etc.) could drive costs beyond the inflation rate of the entire economy. Such inputs are traded on global markets and can be highly volatile. Again, given the volatility and when maintenance comes due, some cost increases could be driven by high input costs. During the housing boom many construction inputs, for example, increased much faster than underlying inflation.
3. As noted by some here, increases in total employee compensation could be driving some of the increases. Certainly we know that city-wide, total compensation increases in recent years (due to the city dealing with unfunded medical care liabilities liabilities and pension increases related to new actuarial accounting and other factors) are driving many of the city’s cost increases (the City Manager made these things clear in his December 17 mid-year budget report).
There may be other drivers, but the combination of these (or other) factors that are leading to faster than inflation growth in service costs are subject to an empirical analysis and we should be able to estimate the relative contribution of each to our current costs. I would encourage those with more insight into these issues to help with such an analysis so we can have an informed conversation about the drivers we do and do not control. Again, I appreciate the issues being raised and think we should talk about them.
One final word–the average annual cost increase listed above covers the entire period from 1980 to 2013. I have not calculated year-on-year annual cost increases but an examination of inflection points in the history of cost increases could assist in an analysis of what is driving them.
Robb wrote:
> An initial concern is that some of the costs presented in the large table
> above are consumption-dependent — meaning costs will go up if more
> is consumed. This is certainly the case for water.
The cost of just about everything (including water) go DOWN (not up) when more is consumed (a farmer pays a lot less for each 10 gallons of water than a Davis home owner)…
SoD, the farmer doesn’t irrigate with potable water, or even treated water for that matter. The water is delivered to the farmer in open trenches that would not comply with either Department of Health water quality standards or Homeland Security anti-terrorism standards. So as a result, the farmer’s water is a lot cheaper as it is consumed by the plant life in his/her fields.
Matt wrote:
> SoD, the farmer doesn’t irrigate with potable water,
> or even treated water for that matter.
If I buy one bottle of drinking water at a Deli in Davis is costs more per oz. than buying a case of drinking water at Costco that costs more per oz. than buying a tanker truck full of purified drinking water (the cost does not go UP as I buy more and more)…
SoD, your point above fails on two key levels. First, for the single bottle vs. the case, you are dealing with 1) a retail sales situation in which the variable costs associated with the retail price of bottled water are significantly larger than the fixed costs, 2) product packaging in which the quantity used/purchased is not controlled by the user, and 3) the delivery costs of a case of water to the retail sale point are essentially the same as the delivery costs of a single bottle of water. Second, in your bottle of water vs. tanker truck of water you have changed both the packaging and the public health compliance levels of the water delivery. The water from the bottle is ingestable “as is” however the water from the tanker truck must be boiled before it can be ingested.
I am again reminded of several year’s ago listening to the CC and Don Saylor questioning the city’s org chart in terms of so many supervisors, sometimes supervising only one or two employees. Is that still true? Are our supervisory positions in line with the work they do and their pay now? If not, that is where I see some cost cutting. And we have cut 103 FTEs primarily by retirement and attrition which doesn’t necessarily mean we have the right people in the right positions. Comments?
I think we all understand the point of getting the model right from the standpoint of equitable sharing of the costs – whatever the subject might be.
What should be of more concern is the overall magnitude of the fiscal challenge we face. It was never a mystery that the new water system would end up costing the community some $17MM-$19MM per year in additional charges – just to continue receiving suitable drinking water. This is the main reason I have been pounding the drum in asking the question of City Council – “What is the plan, what is strategy to backfill this loss of economic purchasing power in the community?”
Now as we look to the balance of 2014 and a $5.1MM structural operating deficit – with more charges to come for roads and schools – the question seems more relevant than ever.
Thoughts?
Sorry for the typo – that should have been $17MM-$19MM (per Jacques in round one). And, no, I don’t care if actually will only be $10MM or $12MM – the point is the same as far as I am concerned.
What is to the be strategy to backfill that hit to our community spending power?
Doby: exactly. The City lacks a plan.
Michael –
Not that its the City’s job to develop a plan – as Dick Dorf has often opined.
Its just that Davis has so much potential to create its way out of its fiscal bind and its rarely ever discussed.