

Looking at two key dimensions – percent of whites, according to the American Community Survey, and percentage of renters, we have analyzed the ten maps put out by Paul Mitchell’s company and noticed some interesting findings as we looked across the maps.
If your goal is to increase the chance of either minority or renter (read: student) districts, then it is fairly clear that seven districts is better than five.
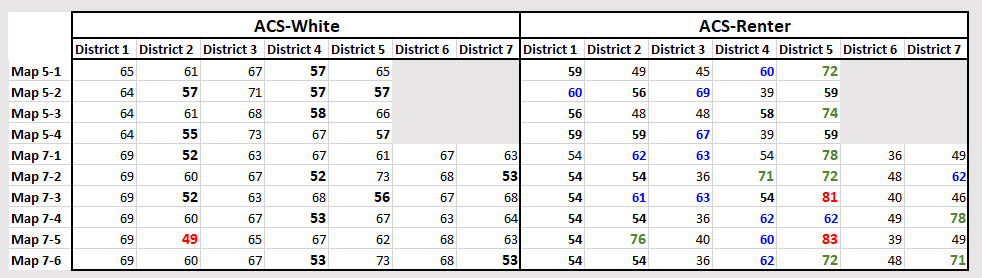
In the four five-district configurations, the lowest percentage of whites in any district is 55 percent. Map 5-2 and Map 5-4 have two or three districts that have percentages in the 50s, while maps 5-1 and 5-3 have barely one.
For renters, maps 7-1 and 7-3 have a single district in the 70s with respect to renters, while Map 6-2 has two in the 60s and Map 5-4 has a single district in the 60s.
Moving up to the seven-district maps, you see that for most configurations you can get down to 52 or 53 white in at least one district. In Map 7-2, there are two districts below 53 percent white, the same for Map 7-6 and in Map 7-5 there is even one district that is majority-majority.
On the renter side, you see two districts that have at least 80 percent renter populations (Map 7-3 and 7-5). There are also districts with 78 percent renters in 7-1 and 7-4. Map 7-2 and 7-6 have two districts with 70 percent or more.
Map 7-5 has one with 83 percent renter and one with 76 percent renter.
Some thoughts:
It is far more likely to be able to draw maps with higher concentrations of both renters and people of color when it is seven-person districts. Every map has a district of 53 percent white or less in the seven-district configuration, while none are better than 55 percent in the five-district configuration.
There are just two 70 percent-plus renter districts in the five configuration, but nine in the seven. There are five that are 76 percent or higher.

There is actually one minority-majority district – District 2 in Map 7-5. One key question is whether they have drawn any maps in order to maximize the minority representation.
Map 7-5 also has the same district, which is 76 percent renter including 57 percent living in multi-unit housing. The 83 percent renter District 5 in that configuration also is 59 percent multi-family housing, but 58 percent white.
We would expect that, given student demographics which is now two-thirds people of color, some of the student-heavy districts would be more heavily people of color. But it is not clear how much that is actually translated into these numbers.
From the standpoint of both renters and the potential for representation of people of color, Map 7-5 seems the strongest – we would like to see what a specifically drawn minority-majority district would look like, if there is one.
—David M. Greenwald reporting


“7-5 also has the same district which is 76 percent renter including 57 percent living in multi-unit housing. The 83% renter district 5 in that configuration also is 59 percent multi-family housing but 58% white.”
Can somebody please explain to me why people not living in the city, south of First St. and east of Richards, on university property, are being allowed to vote in city elections? Why are these non-city residences included in the district maps?
Because you draw the lines for people residing here, not registered voters.
But they are not living in the city so why are they being included? My understanding is they are somehow allowed to vote in city elections even though they don’t live in the city. I would like clarification to understand how this all works?
They only vote if they’re registered to vote in the city. Not sure what you’re saying
People who live South of A and East of Richards, in what I think is called Aggie Village, live on university land that is not part of the city but can vote in city elections. On the maps they are included in city districts although the land they live on isn’t in the city. I’d like to know how this can happen?
Got clarification: “ Aggie Village is in the City Limits. The land is owned by the university and the homes are owned by homeowners but on 99 year ground leases. The city zoning is PD 2-95.”
I’m confused because during the first presentation by the demographer Lucas made a point of making sure the people there were included even though they didn’t live in the city.
https://davis.granicus.com/player/clip/1035?view_id=6
I linked to the tape. At the 9-3-19 meeting beginning at the 1:34:00 mark Lucas states that Aggie Village isn’t in the city. So how is it they get to vote in the city?
To be charitable to Lucas… he was incorrect (at the least)… I say this as one who was involved in processing that annexation,along with Davis Commons, and reviewed the maps and the other plans and documents. Some speak without thinking, or without researching facts… it is what it is.
David’s information is correct…
Ironically, Aggie Village was “ear-marked” for UCD staff/faculty… later expanded to DJUSD folk… later still to City of Davis employees…
The project pre-dated Measure J… given the WDAAC angst, unclear if Aggie Village would have survived a Measure J vote, had it been subject to it… in effect, it was “exclusionary housing”… whatever… it happened, and they are indeed within the City… many reasons, and utilities, emergency services, etc., were big factors in driving UCD to have it annexed…
Do they pay property taxes to the city or is there some other agreement? I know its off topic but I am curious.
Lucas sent me a note correcting the information and apologizing.
That’s actually my own personal goal each morning when I wake up . . .