

by Tim Keller
In parts one and two of this series, I tried to come up with some objective/analytical method for trying to gauge demand for housing in Davis. I undertook this work because of a core belief that “we can’t plan to SOLVE our housing problem if we don’t know the SIZE of the problem.”
In previous articles we saw evidence that suggests that a population of 120,000 might be entirely appropriate for a university town such as Davis: It is the size of Ann Arbor, Michigan (home of the University of Michigan), Champagne-Urbana (home of the University of Illinois), and Lafayette Indiana (home of Purdue). These are all well-regarded and well-funded research universities of very similar size and character to UC Davis.
I am not saying that we need to grow to that size (and certainly not overnight!). But I do think we need to get some feel for the scale that our city may eventually become in a 30- to 50-year timeframe so that we can do long term planning. The theme of these articles is “trying to find some perspective on growth.”
That said, even though 120,000 people sounds like a big leap for a city which is currently only 68,000, a 1% annual growth rate starting in 2020 gets us to 110,000 people within 50 years and a 2% growth rate gets us to 183,000 people in that same period and to 120,000 people in 30 years.
So the population numbers I deal with in this article might sound big because I’m talking about long timeframes here, but these are not unreasonable growth rates by any  standard.
Taking this long view of our growth needs is nonetheless incredibly important because, as I will reveal below, short-sighted decisions we make today are very capable of limiting our options in the future.
So for today’s discussion I want to take that long-term perspective and explore what this level of growth might look like.
This is a thought exercise: Many of the conclusions I come to below are simply going to be my opinion, and I’m sure that other people asking these same questions will come to different conclusions.
The only thing I hope to accomplish here is to get YOU to ask yourself these questions as well, because even though we are talking about long-time scales here, there are issues in front of the council right now which will to a significant extent determine whether the future described below is even feasible, and it would be a shame to make those decisions in a short-sighted way.
Fitting Long-Term Growth into an Urban Limit Line
Specifically, I think it’s helpful to discuss the “how” of growth in the context of the urban limit line that has been recently proposed by former Mayor Robb Davis, because discussing such a limit naturally requires one to imagine the end-state of the lateral development of our city.
The urban limit line as a concept is not new of course; many cities have them and for many of the same reasons we adopted Measure J. But it is a newer concept for Davis voters and beyond the fact that I think it’s just a good idea, it turns out to be a good framing device for this particular analysis as well.
Let’s start out by drawing what I think might be a rational line for Davis, perhaps something along the following:
This is just a guess of course, for the sake of my analysis, but it likely isn’t far off. We have floodplains to the north, east and west and Solano County (and poor existing road access) to the south, which to some extent limit our options for a line drawn further out.
Within this boundary, I have broken out various parcels indicated here:

And I have added up the acreages of those parcels are as follows:

The western parcels here are questionable as to whether they should be included. Distance-wise, they make sense to help to “round-out” the city and they are on a major road corridor, but there is also a periodic flood plain there which complicates things. So I will be providing totals in this analysis that consider a total boundary line both with and without those western areas.
Note: I am leaving the project proposed for south/east of El Macero out of this at the moment because, knowing that even El Macero is not within the city limits, I really don’t know how to treat that one. Plus, it just seems very disconnected from the rest of the city. I’d be interested to hear if anyone else thinks that is a desirable expansion direction for the city, or if we should draw our lines more conservatively.
Within the lines as drawn there is a total of 1500 acres that are theoretically developable (or 932 acres if the western lots are not on the table), but wherever we draw the line, I feel we should set that line as a REAL LIMIT: Not a temporary line that will just be moved in the future.
Is such a “real” limit possible? If we take it seriously, the answer is yes. But it does have to be taken seriously and we have to start taking it seriously immediately with the growth issues that are currently on the city’s docket, because to make it work we have to make very wise use of the limited number of peripheral sites available to us.
So lets get into it. Going back to my analysis of comparable college towns, we saw a number of communities with similarly sized universities having populations in the range of 120,000 people and some up to 170,000 people. With a growth rate between 1 and 2 percent per year, we might easily hit these numbers in the next 30 to 50 years.
For now, let’s adopt the lower 125k figure as our target. With a current population of 68,000 people, that means planning to conserve room for 52,000 people within the boundaries of this limit line, including whatever additional capacity we get from infill, redevelopment and upzoning.
Given the California average of 1.9 people per dwelling unit, that means we might be building 27,000 homes + apartments + condos in that timeframe.
How much can we densify and infill ?
Before we do the density calculations for the limit line, however, we need to figure out how much of our population planning target can be provided by densification and infill.
Judy Corbett summed up the variety of infill opportunities around town and arrived at a number of 7036 units. For now, I’m going to take that number at face value, while acknowledging that there are those who think it optimistic.
Since we are looking at a 30-50 year time horizon, we must also look at what kind of additional density we might get by re-zoning existing parts of the city. Both Robb Davis’ “Densify Davis” and Judy Corbett et al.’s recent letter both called for densification of existing parts of the city, particularly along arterial corridors.
The densification that occurred at the “Identity” site on Oxford Circle is a good example of moderate density buildings at the end of their lifespan being replaced with something much denser. If we can repeat that pattern there is potentially considerable capacity for additional housing within the existing city footprint, but I have seen no analysis describing to what extent this kind of infill may be possible or what kind of impact it can have.
To try to get a preliminary handle on this, I identified a number of properties which I felt might be candidates for being demolished and replaced sometime in the next 30 years.
Now, this is a very subjective and cursory exercise to be sure, but i wanted to get some sense for the potential impact of this “arterial densification” that might be possible, and so I took Davis’s existing zoning map which you can find here, and looked at the medium density parcels (in brown) and then drew bounding boxes around the ones that I thought might be densified.
The resulting map is here:

I tried to not count any properties that have been built in the last 10 years, or those which are already sufficiently dense, but in reality, some of the properties here are clearly older and better candidates for replacement than others. So we can’t count on all of these properties being re-built to a denser form-factor by any means.
The total area represented here is 340 acres. To that we can apply some assumptions and come up with a range for what we might get out of densification of properties like this.
I did this in two different scenarios: one more conservative where fewer of the properties turn over, and one more aggressive where not only do more properties get remodeled, but they are remodeled to a higher density type.
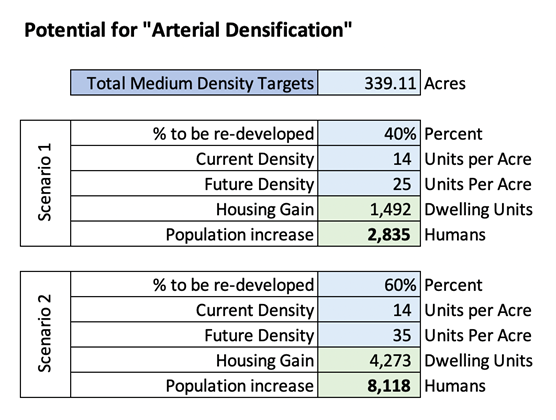
This is a big range between these two scenarios here to be sure, but even the more aggressive estimate still only nets us an additional 4,200 housing units out of 27,000 we might be looking for in this 50-year time window.
If we accept the more aggressive estimate as the goal and then also subtract the 7,000 units identified by Corbett, then we are left with 15,000 dwelling units, and roughly 28,000 people that need to be allocated to peripheral projects.
The Simpler Density Math
This brings us finally to the discussion of density within the proposed urban limit line, which is an extremely timely subject given the debate around the peripheral projects currently being urged by developers onto the City Council’s agenda.
Starting with the simple math we can divide our 15,000 additionally needed units by the amount of added acreage available within the proposed urban limit line. Since we are unsure about where to draw that line, I have included the acreage both with and without the western portions (1527 and 932 acres respectively). I have also calculated what this looks like if our 50-year population cap target is 120k (~1% growth) vs 170k (~2% Growth)

What we find is that with the lower target population number (similar to Ann Arbor) and the larger limit line, we can get away with a density of 11 dwelling units per acre, just slightly denser than what is proposed for Village Farms. At the other extreme, if we choose a more compact limit line and want to ensure that we are capable of hitting a population like Fort Collins inside of it, we would need an average density of 47 du/acre, which might be more than we have a stomach for.
(Now before you reject the notion of even aspiring to be like Fort Collins or Ann Arbor, keep in mind that in the US News ranking of 150 best places to live, Ann Arbor is #14 and Fort Collins is #24. Sacramento comes in at #127)
Given these options, I think that the most reasonable target is to go for a smaller limit line and a smaller population target. The smaller limit line for the sake of environmentalism: just because we might have space to expand onto, doesn’t mean we need to, and the flooding potential for the western properties means they might be out of the picture anyway.
I’m also thinking the smaller population target is the correct one as well, because when building a community, if you don’t want to just be encouraging a lot of outbound commuter traffic; you need to be building both housing AND jobs.
I will discuss this in more detail in the next installment in this series, but even though we have a lot of workers commuting inbound every day, I think we can easily accommodate that number inside the 125k population cap and even allow for growth of local industry. Getting to 170k people employed locally would mean developing considerable additional industry in this town, and we would have to figure out where to put THAT as well. The DiSC site wasn’t intended to accommodate 50,000 workers… I just don’t see it happening.
So I’m thinking that the pragmatic and environmentally responsible target for our urban limit line is JUST the north/eastern properties including Village Farms and the remainder of the Mace Curve, and an overall density minimum of 20 dwelling units per acre.
Again, this is a thought exercise and these are my opinions. I’d also be interested to hear what you think.
What do these densities look like?
Now, so far we have just been calculating density numerically, but these numbers need to be translated into human scale so that we can get a sense for what they mean.
To get that perspective, an easily accessible guide that shows examples of building types with these kinds of densities found here, as well as this document here.
There is also a great “visualizing density” page here which shows real-world sample projects at various levels of density. If you are concerned about what higher levels of density might look or feel like, that page is great, because it shows you really CAN build nice projects at higher density, like this single family development which is at 36 units per acre in Seattle, that still has plenty of trees and outdoor space.
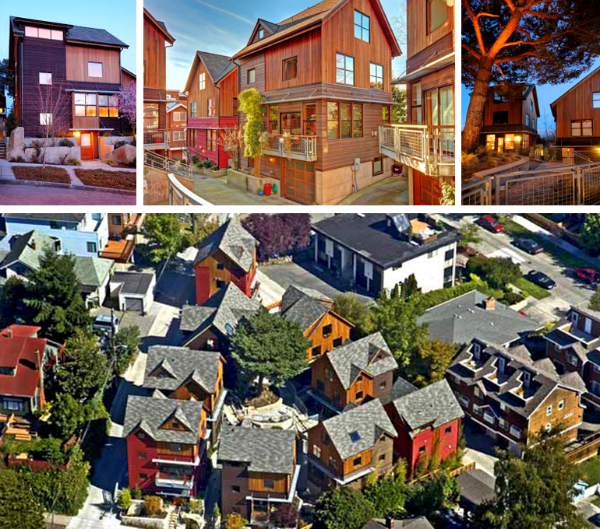
What I hope you see in those documents is that there are a variety of housing forms that are in the 20 -50 du/acre that you likely already recognize as being present in our town.
The Blended Density Math
To expand on this vision of what kind of density types we might need, I think it might be helpful to explore what the math of that blend might be and what kind of property types we are talking about if we want to hit an average density of at least 18 du / acre.
There are an infinite number of ways to mix these property types to end up with the same average density, but here is one example:

In this particular mix, 30% of the land is dedicated to single-family housing, which represents 10% of the dwelling units. The classic “missing middle” housing types—townhomes, condos and small apartment buildings—are 60% of the land and provide 54% of the units, and the higher density 4- and 5-story condo structures take up only 10% of the allocated land but provide 35% of the units. This last category should also likely be mixed-use commercial, providing local shopping/dining/cafes and neighborhood support services in these newer denser neighborhoods.
By walking through this calculation, I hope that readers come to understand the incredible power of density here. You don’t need to create a New York City skyscraper: even modest townhome and condominium construction types can make a huge impact on the number of people who can inhabit a given acre of land. It is the ultimate answer to sprawl.
To prove that, let’s return to the simpler math from the previous section. If we set a lower target for density, let’s say 10du/acre, and we use that density level for all of our peripheral projects inside our line. Then we can only end up adding 17,000 people in the peripheral sites bringing our total population (including the infill and redevelopment) to 94,000 people.
If we only grow at 1% per year, that means that we run out of buildable land in 30 years.
What then? Well if we continue to build at low density, then we will need to find another 1,172 acres to to develop and move our line. It will mean that the first limit was meaningless.

Now, there is perhaps an argument that expanding the limit line in a 30-year timeframe isn’t the end of the world, and that the previous line would have “done its job” in curtailing low-density sprawl while it was in place… But that still doesn’t sound like a “limit” to me, not when we could have chosen to take the first line seriously and built more densely in the first place.
I would prefer to have a limit line that is a real limit and that buys time for the city to figure out exactly how it can densify its core. While we all seem to agree that core and arterial densification is our priority, in the real world it will happen very slowly. Adopting a “real” limit line will give time for that to happen.
I suggest that during the course of 50 years, while the capacity in our peripheral zone serves as a buffer, we develop a general plan which includes the up-zoning of selected lower density single-family neighborhoods to higher density formats on a schedule which gives inhabitants decades of notice.
These issues are difficult for all cities that densify old neighborhoods, (and they are the plot of the great movie “UP!” ) but the average time people spend in a given house is only 16 years, and if you are given notice that your zoning is going to change in 20 years, you give people ample opportunity to make the necessary adjustments. I think the long time-scales we are talking about here make that kind core densification process a lot more realistic and fair.
If that is how we proceed after the adoption of this urban limit line, then we can have every expectation that it is a permanent line.
Summary
While the urban limit line proposal is still in its formative stage, I think this strategy checks out, and it presents a more controlled/rational way to avoid urban sprawl than the divisive and haphazardly planned Measure J/R/D process.
There is sufficient supply for 30 to 50 years worth of housing inside of a compact and reasonable urban limit line, if (and only if) we build those properties with sufficient density.
As I have shown here, the density required to achieve this vision is not unreasonable by any means; it can be achieved through missing middle building types which we already see throughout our community.
This is the narrow path that I think we need to walk in order for our city to find a truly desirable solution, given its current challenges, but we do need to start thinking this way NOW.
At the moment, we have two projects which developers are exerting pressure on the City Council to get on the ballot. I had a chance to speak directly with one of them recently and I brought to them these thoughts and my concerns about the low density level of their project.
They were hesitant about adopting my suggestions because they were concerned that if they came to the city with a project that was TOO dense, it might be rejected at the polls.
Because a Measure J/R/D campaign is a million dollar, all-or-nothing gamble, developers are incentivized to play it safe in terms of density in order to maximize their odds of winning. To them, a less dense project that passes is superior to a denser project that fails, even if they might have made more money with the higher density plan.
To me, this is the ultimate irony imposed upon us by Measure J/R/D: As discussed above, the best way to guarantee urban sprawl is to build at low density, but here we have a process where Measure J/R/D actively discourages more sustainable levels of density because the developer needs to get through the Measure J/R/D vote!
The political process that was sold to us as a safeguard against urban sprawl is, in effect, to no small extent, causing it!
In the final installment of this series I will be discussing the issue of transit and decentralized planning as it relates to the density and sustainability issues that I have raised here and why the practice of creating large swaths of single family zoning is a mistake we should never repeat.
Until then, I will be interested to hear your thoughts about where an urban limit line might be drawn, where you think our density targets and population growth rates should be, and how you would try to balance these demands on our community if given a choice.


Tim, you have left an important component out of your land calculations … jobs. Davis’ current anemic (and arguably NOT resilient and NOT sustainable) economy has 16,077 jobs for its population of 66,850 residents (24%). So you need land for the employers of 24% of your population growth.
If you target a 52% local jobs rate like Champaign and Urbana and Richard McCann’s example Bellingham, Washington have, then you need even more land for employment. If you bring the 16,077 current jobs up to that same 52% you need even more land … enough for 18,750 additional jobs.
https://datausa.io/profile/geo/davis-ca/#economy
Don, you data is faulty on two levels. (1) Datausa is counting jobs of Davis residents, 21,000 of which are outside the City limits. (2) Datausa under reports the jobs by 5,000. The linked graphic provided below from the US Census shows the accurate factual job situation in Davis. 16,077 jobs in Davis plus 21,326 jobs that Davis residents commute to … most of which are reached by travel on Interstate 80.
https://davisvanguard.org/wp-content/uploads/2023/06/Screenshot-2023-06-14-at-11.08.48-PM.jpeg
Matt, I took a look at the screenshot, but can’t tell if the numbers presented include or exclude UC Davis employment on campus. When I ran the numbers last time both the total # and % of UC Davis faculty and staff who live outside of Davis continued to increase. Roughy (from memory) 10,000 commute from outside of Davis and is around 65% of campus employees.
UC Davis has done a good job meeting their requirements by the MOU for student housing. However I do not believe they will ever build a significant amount of housing for campus employees.
It would be interesting to see what inflow/outflow looks like for earlier census years — 2010, 2000 — to see what the trend is over time.
Matt
You’re actually referring the faulty data. I can’t figure out why the Census data is incorrect for Davis, while it is correct for several of the other cities in Tim’s original list. But the values in the inflow/outflow graphic are not consistent with the population and age data from the Census. I previously posted for you a link to that data–did you check it? I came up with 32,000 employed in Davis through a separate calculation using that data plus the Employment Development Department (EDD) unemployment data. The data you’re referring to would imply either an unemployment rate approaching 20% which obviously isn’t the case, or the Census has badly calculated the number of individuals in the labor pool. (I see that BAE has the same error in its 2018 report for the Downtown Plan. I’ll have to follow up with them on that. It looks like the GHG inventory (probably relying on the same data source) also is incorrect.)
When I look at the UCD inflow/outflow, I see 22,000 jobs on campus, but it looks like there’s only 18,000 there. (https://www.zippia.com/university-california-davis-careers-671413/) There appears some significant problems in reconciling the local employment data.
Richard, I’m in an all day meeting so won’t be able to give you a response until this evening.
your calculation was 37,000 not 32,000.
Don G
Here’s the data for equivalent map for UCD that shows 22,000 workers (instead of 18,000). https://onthemap.ces.census.gov/cgi-bin/report.py?mode=details&settings=%7B%22selection%22%3A%5B%22otm_eddf5654dc024cde839b32146ba7f6e7%22%5D%2C%22color%22%3A%5B%22%230000AA%22%5D%2C%22comparison_geom%22%3A%22us_plc%22%2C%22destination_rollup%22%3A%22us_plc%22%2C%22job_type%22%3A%22jt00%22%2C%22ac_segment%22%3A%22s000%22%2C%22analysis_type%22%3A%22inflow_outflow_report%22%2C%22geom_operation%22%3A%22ignore%22%2C%22year%22%3A2020%2C%22origin_dir%22%3A%22home%22%2C%22ap_segment%22%3A%22s000%22%2C%22origin_type%22%3A%22work%22%2C%22labor%22%3A%22s000%22%2C%22highlight%22%3A%22all%22%7D&format=full_html&report_id=otm_43b56162138d4c7f86c152f60f00647e&title=Inflow%2FOutflow%20Report&subtitle=&download=false
Additional maps can be generated here:
https://onthemap.ces.census.gov/
.
Richard, your calculation provided in your comment https://davisvanguard.org/2023/06/guest-commentary-how-big-should-davis-be-university-towns-part-2/#comment-473652 (text of that comment provided below) came up with 37,000, not 32,000. The 32,000 number came from the link that Don Shor provided.
.
Unemployment is based on the number of residents in an area who are employed, regardless of the physical location of their employment. 37,000 City of Davis residents are employed, but there are only 16,077 jobs within the City Limits. Both those numbers are correct, and they do not conflict with one another.
.
Don, the jobs in the City of Davis do not include jobs on the UCD campus since those jobs are outside the City Limits.
I requested and received from UCD’s official channels on March 23rd the current UCD employment numbers, which show 11,439 faculty and staff on the Davis campus and 16,600 faculty and staff on the Sacramento campus. Of the 11,439 on the Davis campus, 3,597 (31%) reside in the City of Davis.
Here is a screenshot of the first 25 rows of the spreadsheet UCD sent me. It is sorted using the residence of the Davis campus employees in high to low order.
https://davisvanguard.org/wp-content/uploads/2023/06/Screenshot-2023-06-15-at-11.37.19-AM.jpeg
Matt
Two problems with the graphic. First it shows only 25,000 people employed residents–4,000 working in town and 21,000 commuting (many across Russell to UCD). I took the Census data on population and % of population in the job market and then adjusted for the unemployment rate (just under 4%) to get to 32,000 (I rechecked after that comment and came up with just under 32,000). The 16,000 job number does conflict with the 32,000 employed, because the 16,000 jobs actually relates to the 25,000 employed value–it doesn’t stand independently. So there’s a phant0m 7,000 jobs either in or out of town.
Second, the related UCD inflow/outflow shows 22,000 jobs on campus, but UCD reports only 18,000 jobs (and I didn’t dig in enough to determine if that included or excluded the UCD medical school/center in Sacramento.) That’s another 4,000 job discrepancy.
If the one part of the equation is incorrect, we can’t trust that the other part is correct either. It all must be in balance. So we have to discount the inflow/outflow chart until that error is resolved.
Matt, no fears, im getting into jobs a lot more in the next (and final) installment here.
I will point out two things that Ive said thus far though that point to the fact that I agree:
1) You will notice that I only included the housing portion of DiSC in my land use map. The rest of that site, I think, is still the best place for expanding industry in this town.
2) I discussed jobs in terms of whether I thought the 120k or 170k population numbers were appropriate.. I dont see us having room for the industry to warrant 50k worth of population growth, and I dont see much utility in building population for the sake of population (especially outbound population)
Its going to be better for us to develop our population in lock-step with our economy: right now we are at a deficit with at least 12k people commuting IN every day… though that census data is apparently omitting some jobs which Richard McCann has pointed out to me… And campus transit surveys tell a similar story… but they do not include off-campus commuters to local industry… I will contact you offline for help in parsing those numbers if its okay with you.
Relying on the anecdotal assessment of a single real estate agent is as useful as relying on a single stock broker to make financial market investments. The record shows consistently that it is impossible for a single stock picker to beat the long term market average. There is nothing other than Ron O’s unsubstantiated assertion that none of the rest of us have any ability to assess to suggest that anyone can make such a singular forecast successfully. Ron O’s statement must be discounted entirely until he can bring forward any supporting evidence other than his wishful fantasies.
Everyone working in Davis or on campus already has a home. They’re not going to move to Davis – assuming that they’re not already there in the first place.
But do you know who WILL be moving (out of Davis and the entire area)? Those who (for the moment) work at Genentech.
https://www.sfgate.com/tech/article/genentech-close-plant-near-sacramento-bay-area-18138323.php#:~:text=In%20March%2C%20the%20pharmaceutical%20giant,in%20all%20of%20Solano%20County.
The Genentech facility in Vacaville employs hundreds of people, many of whom live in Davis (and Spring Lake, for that matter).
A real estate agent (whom I know quite well) told me that the closure of the Vacaville Genentech facility will significantly reduce demand for housing in the entire area, including Davis. With a corresponding drop in housing prices.
This agent has been remarkably accurate regarding predictions, over the years I have known him.
Specifically how many Ron? 5, 10, 15? Who is this mythical unnamed real estate agent anyway?
Walter: Obviously, he didn’t say (or know) exactly how many Genentech employees there are in Davis or Spring Lake. But some were his clients – in both communities.
Enough to determine that its closure will impact housing availability and prices. He works for the company where Will Arnold’s father was a partner, and which bared that family name. I believe it’s the the biggest local real estate presence in Davis.
Perhaps the more-important question is whether or not that’s just “his” opinion, or if that’s the opinion of the local real estate industry. (I’ve found that these guys generally don’t come up with such determinations on their own.)
But sure, when you close down something like Genentech, it impacts far more than Vacaville.
Will it reduce Davis single family housing prices by an insignificant $1,000 or $2,000 considering most of those houses cost several hundreds of thousands of dollars?
Walter: It doesn’t work that way.
When you have some 1,000 or so employees forced or incentivized to leave an area (e.g., Vacaville, Dixon, Davis, Woodland), it impacts the entire market. The reason being that pricing and availability in one local city impacts the other local cities.
As I recall, the agent expects housing prices to drop in Spring Lake, for example, by about $50,000. I don’t recall if he mentioned the impact on Davis, but he (and others) have told me that there’s more Genentech employees in Davis, vs. Spring Lake. (And that the ones in Davis are more likely to be management-level employees.)
Will it reduce Davis single family housing prices by an insignificant $1,000 or $2,000 considering most of those houses cost several hundreds of thousands of dollars?
That answer is no. Our housing market is in such under-supply that the loss of a few hundred jobs half an hour away is not going to affect our housing market..
… or Vacaville’s. Ron’s gambit is all about being selective about the facts. He points out the closure of Genentech but doesn’t mention “Agenus” another biopharma company that is setting up a brand new shop ALSO in Vacaville… If genentech hadnt closed, there would have been net positive job growth, but likely it will now just be flat.
And THAT of course assumes that the Genentech facility will never bear another employee ever again, which is ABSURD. That facility is a huge capital investment that will be sold to another biopharma company. There are multiple large companies whose MO is to never build their own facility, but instead purchase existing ones and re-purposing them. (My former next-door neighbor here in Davis is a buyer for exactly that kind of company.) It avoids a lot of startup capital costs in a business which is insanely capital intensive.
Tim’s assessment of the Vacaville situation is spot on.
Again, the local real estate agent disagrees with you (and is in a better position than you are to know). And he unequivocally stated that it would impact the Spring Lake and Davis housing market – significantly.
He’s the one who brought it up in the first place, and knew all about the closure. You can be sure that it’s the “talk of the local realtors”.
Even bigger impact there, no doubt.
The agent did not discuss that, but you’re free to provide more information (e.g., number of new employees expected as a result of Agenus, what they do, the type of jobs they will offer, etc.). I don’t claim to know anything about this.
Again, the agent is the one who (apparently) believes there’s a net, significant loss of good jobs – enough to significantly impact the Davis market.
The agent said that the Vacaville facility was the largest in the world (or country?) of that type. And that no other company is large enough to take-over that specialized facility, entirely. (In addition, they would then have to compete with Genentech’s operations elsewhere, where costs may be less. I believe the agent said something about a newer, overseas production facility – in Korea? I don’t recall. But for sure, the U.S. will increasingly not be able to compete with production coming out of other countries, where costs are less. These type of pharmaceutical products can be made anywhere there’s a facility to do so.)
So again, Genentech (despite already HAVING a facility in Vacaville) has decided that they can save money by abandoning the Vacaville facility. As noted in various articles, they are going to do so WHETHER OR NOT they find a buyer for that facility. (What does that tell you?)
He did state that “portions” of it may eventually be used by other companies.
It’s funny, how some constantly brought up the fact that Davis “lost out” on Genentech to Vacaville (e.g., blaming Measure J, etc.), but are now downplaying its loss in Vacaville.
Again, there are a significant number of Genentech employees in Davis, Spring Lake, etc.
“Again, the local real estate agent disagrees with you ”
Which one?
I’ll secon David’s question to Ron, “ Which real estate agent?”
Matt: I don’t know that the agent would want me sharing his name on this blog. I’d be willing to tell you that privately.
But if you doubt that the agent thinks this is a factor, I suspect that you can speak with any local agent (e.g., at Coldwell Banker) and ask them if they think that Genentech’s impending closure will impact the local housing market. I suspect that every agent in the office knows about the closure, already.
Or again, I’ll tell you his name (privately), and you can ask him yourself, directly.
But when a region loses about a thousand good jobs, it only makes sense that it has an impact.
Jobs are what create demand for housing in the first place. (And yet, the “housing crisis people” are the same people who advocate for the creation of more jobs. What does that tell you in regard to their actual concerns and goals?)
Ron, the chances of you and I speaking privately are somewhere between slim and none, and slim has left the building. As you know my personal email account has your email address blocked. So I will contact one or more of my real estate agent friends to get their take.
Wilmington Delaware has seen over the past two decades the closure by duPont of several of their facilities. Every single one of those facilities quickly saw new life with a new owner employing new employees productively making and inventing.
We’ve communicated many, many times privately, in more than one way. I had no idea that you “blocked” me from sending messages – none have bounced back. I have noticed a deterioration in our most recent conversations, so it’s fine with me if you’ve chosen to block me. But again, I don’t know why you think I’d “know” that, already.
Sure – go for it.
I believe the agent I’m referring to was actually the original “relocation agent” for Genentech. He is still active.
Don’t know anything about that. Again, I’m just relaying information that was told to me.
Again, the agent I’m referring to noted that the Vacaville facility was the largest of its kind (by some measure – the world?), and yet they’ve chosen to relocate elsewhere (after already making that investment in Vacaville).
Again, the agent said that there are no other companies of that scale who would likely take-over that specialized facility in its entirety.
They’ve got six years, and Vacaville actually has a robust economic development team in their city government. Impact on the housing market in the Vacaville/Fairfield/Yolo area is likely to be de minimis. This is another irrelevant digression. Amazing how many of them come up during discussions of what Davis needs.
Further, that Vacaville already has a well trained biotech workforce (and UCD nearby) makes the city attractive for other biotech firms. Pointing at the future closure of Genentech is just like lamenting the closure of semiconductor fabs in Silicon Valley. IBM built one of the original plants in 1957 and closed it by 1996. We can see how that worked out…
Having talked to some of the folks who were behind some of the recent biotech projects, they like places like Vacaville because it’s fairly close to UCD and they can tap into that workforce.
Don: I’d trust what a real estate professional tells me regarding the impact, more than a guy who sells plants for a living. Again, this is exactly the type of thing they pay attention to.
For that matter, the agent I know is also one of the few local “relocation agents”. (I don’t remember if he was the primary agent for Genentech.)
And he literally told me that there’s a significant number of Genentech employees in Davis and Spring Lake, and that it would impact the market.
By the way, yours is yet another example of a myopic view, in regard to Davis’ “needs”. It is not an island. .
And this is also why Davis’ “needs” is not an actual category. This entire exercise is “fake”, based upon assumptions that don’t exist in the real world.
“Workforces” are mobile, especially those right out of college. The fact that someone went to college “down the street” (and wasn’t even from this area in the first place) seems pretty meaningless, for both potential employees and employers. (But that’s just my opinion.)
Would have to look it up again, but I believe that there’s been articles in The Chronicle regarding the abandonment of biotechnology companies in San Francisco (as part of the overall tech exodus).
It might be interesting to see if Genentech is offering relocation opportunities/packages for their employees. As I recall from the article posted a few days ago, they are planning to expand their operations in Southern California. (Would have to look up the article again, to see.)
Of course, that won’t help in regard to any overseas expansion, as it’s not likely that employees would follow them there. I think the agent I’m referring to said something about Korea, but I wasn’t paying that much attention. But again, he handled relocation for some of the existing, high-level employees – including at the highest level in that place. I’m starting to remember more about our recent conversation.)
But by all means, all of the growth advocates on here (who already have motivation to downplay this message) I’m sure know better.
Again, Genentech is closing that facility, WHETHER OR NOT they can even find a buyer (per the article I posted the other day). That sounds pretty “committed”, to me.
Another factor you need to consider is the soil quality of the proposed annexed land. Those western (northwestern) parcels you so quickly dismissed have for the most part very very poor soils that don’t even support growing hay, much less crops, so they are ideally suited for urbanization.
The flooding can be addressed by a flood control channel that connects Cactus Corners with the South Putah Creek Bypass. That flood control channel would parallel Pedrick Road.
As I tried to say multiple times here… this is a thought exercise and some of the decisions I made to try to draw a line are subjective and made for the sake of starting a conversation. So long as we are dealing with facts, thinking big picture, and keeping sustainability ( environmental AND economic ) at the top of our priorities list, then I really dont care exactly where we draw the actual line…
I just want a well considered process that isn’t making long-term land use decisions blindly, which i fear is exactly what is happening today.
Matt
Solving the flooding problem is significant there. The intersection of Lake and Covell and the land north has flooded on average at least once every 5 years despite having a floodwater retention pond. Along with 2023 and October 2021, it flooded in 2019, 2017, 2011, more than once in the 2000s, 1998 and 1997 while I’ve lived here. This problem is getting worse because the addition of orchards to the west has made the ag land less absorbent and increased runoff from the northwest towards Davis. 113 stands as a barrier to it going farther.
Richard, the flooding in those areas is “sheet flooding.” I’m pretty sure you know that the depth of the flood waters is almost always less than a foot in depth, more often than not a small fraction of a foot in depth. The primary source of that flooding is Willow Slough west of Pedrick Road. Connecting a north-south flood diversion channel to the South Putah Creek Bypass would almost completely eliminate that flood risk. Berming the peripheral edge of any development the way Bretton Woods has done would provide even more flood protection. That wasa what was done at El Macero and the portion of the City east of Mace and along Cowell.
If we can solve the flooding problem out there, then that will help with reaching the higher population levels that correspond with those in similar commuter college towns. However, those were dismissed more quickly because the property developers apparently see this as larger barrier than you do. Clearly the congestion problems and likely political opposition would be less so there must be another factor at play pushing those parcels down in interest.
One additional morsel of food for thought … why do you so blithely dismiss Solano County land as part of the urban limit line? Access to Interstate 80 from Old Davis Road would be easy … very easy.
Similarly, you blithely dismiss the development south of El Macero which comes with jobs and renewable energy as well as housing. Why are you throwing out that proposal?
Full disclosure: that development is IMBY.
California Government Code 56741. Territory may not be annexed to a city unless it is located in the same county.
Why does it have to be annexed? Tim’s example of Champaign-Urbana is actually two cities, not one. Similarly, his Indiana example is two cities, Lafayette and West Lafayette.
Further, Davis annexed Nishi, which I believe at the time was in Solano County.
Do you think that Champaign plans Urbana? Or Sacramento has land use authority over West Sacramento?
I didnt mention it much in my articles, but College Station and Bryan Tx are basically the same city as well…
But if we want to expand south and put a sister city in Solano County… now we are talking about tacking on a different municipality in a different county and figuring out how to connect the two in a rational way…
I think my solution of just building “missing middle” housing around the mace curve is a LOT easier by comparison… (understatement)
Matt
Your solution ignores the fact that these “twin” cities started as separated neighbors in the 19th and early 20th century and then grew together. And you’re ignoring the whole problem of getting the Solano LAFCO to go along with creating this new city. That ignores how disconnected such a town would be from Davis. If you think El Macero seems remote, imagine what a town out beyond Putah Creek would look like? (And it will not be built on the UCD land north of Putah Creek.)
Solano County’s Orderly Growth Initiative precludes any consideration of housing that is not adjacent to an existing city within the county without a county-wide vote. This is a pointless digression.
Im not dismissing anything out of hand, but I hope that one lesson from the density analysis i have conducted is resoundingly clear: There is a fundamental tradeoff we need to consider: Higher Density on LESS land, VS lower density on MORE land.
If we accept the fact that growth is not optional, then this is really the big picture decision we need to make. If we truly value the preservation of farmland, then the choice is pretty clear.
Reading Tim’s articles and doing my own analysis, I see that there is not one type of “college town” but in fact four that hosts large universities (usually state).
1) An isolated city that is more than an hour away from a large metropolitan area so that commuters don’t live there and it does not serve a significant regional industry other than production agriculture (where the services more often are dispersed to smaller towns). Tim’s list is dominated by these types of cities. These cities have population/student ratios less than 2 to 3.
2) A regional center far from other metropolitan areas which has a dominant industry as a major employer, e.g., forestry or manufacturing. Bellingham and Eugene/Springfield (both forestry) are two examples that were not on Tim’s initial list; East Lansing/Lansing These towns have many more jobs beyond the university but these are not dependent on the university. They have ratios that are 4 or much bigger.
3) An inner suburb that has job spill over from a major city as well as many commuters. Berkeley, Palo Alto (a college town despite Stanford not being in the city boundaries), Cambridge and Chapel Hill/Durham are examples. None of these are on Tim’s list. Like regional centers, these have ratios 4 or much bigger. (Some of these are spatially constrained like Berkeley.)
4) A commuter city within 40 minutes or less of a major city. These cities house both commuters and university staff and students. These towns often have substantial university related businesses. On Tim’s list, these include Ann Arbor, Lawrence, KS, Ft Collins, and Davis. All of these other cities have population/student ratios 2.4 or higher. (If anything, Davis’ position between Sacramento and the Bay Area implies a higher ratio, not lower.)
It’s this last group which is our true set of comparables. All of these cities have populations greater than 100,000 with the smaller ones matched with smaller universities.
The other key insight from Tim’s articles and identifying Davis as a commuter college town is that a restricted housing market favors commuters, not local employees and students. As household income rises, commuters gravitate toward either the downtown or farther out into the suburbs. So the commuters to either Sacramento or to the Bay Area who move to Davis tend to be higher income than the locals and can outbid those local employees for housing.
Ironically, Measure J grew out of the resentment of the new commuter neighborhoods built in Mace Ranch and El Macero Estates and a wish to preserve the town for locals. Instead market forces intervened as they usually do, and instead we’ve undermined the very premise of Measure J. We are destroying the very fabric that we were trying to save. We are becoming a community of isolated households that leave town during the day.
Instead, we need to accept our morphology, like being an ectomorph, endomorph or mesomorph. I’m an ectomorph who will never play in the NBA or throw the shot but I can run a long ways. Davis needs to plan for meeting the housing demands of both commuters and local employees in a way that minimizes overall travel to reduce our GHG emissions. Tim’s plan maps out a possible path that could achieve that goal of getting us to a healthy housing market.
Richard’s comment above is an excellent effort to take this incredibly complex topic and break it into less complex components. Using Richard’s subdivisions, I would like to look at the question “What is a college town?” using Palo Alto as an example. To do so here is Richard’s comment about Palo Alto.
.
The US Census graphic below shows two things about Palo Alto,
(1) over 100,000 people who live outside Palo Alto have their job(s) located in Palo Alto. Since the Stanford campus is outside the Palo Alto City Limits close to 100% of those 100,000 people who are employed in Palo Alto but living elsewhere are filling non University jobs.
(2) Arguably Palo Alto long ago stopped being a college town and became a technology industry and venture capital epicenter. The census report shows that less than 4,000 of the 106,000 jobs in Palo Alto are in the Education industry category.
The Census data for Cambridge isn’t as massively skewed away from education as Palo Alto, but there too there is little doubt that Cambridge has long ago “graduated” into a city that is much, much more than a college town, and the population to student ratio reflects that graduation.
How does this apply to Davis? (1) When you look at tha
a
Three times now the Vanguard site and its #@!^¥@# advertisements has restarted the screen and blown away everything I have typed. Here is try #4.
First, here is the Palo Alto jobs graphic.
https://davisvanguard.org/screenshot-2023-06-20-at-6-50-46-pm/
and here is the conclusion that was cut off
How does this apply to Davis? (1) Palo Alto and Cambridge are examples of college towns that have “graduated” into being something much, much more than a college town. The jobs numbers and trends for Davis show a city that is nowhere near “graduating.” (2) Arguably those jobs numbers and trends over the last 25 years show a city that can be said to have “dropped out” and is no longer a college town, but rather a bedroom community.
Matt
I don’t think Palo Alto or Berkeley or Cambridge are relevant to our discussion about Davis because those cities are so closely integrated into the larger metro area. That’s why I called them out separately. (And it’s also why we should ignore regional centers that I identified (the second type) like Eugene and Bellingham.) There’s really nothing for Davis to learn (at least yet) from those cities.
The only relevant group is the 4th one I identified–the commuter college towns like Ann Arbor, Fort Collins and Boulder (which has a population of 105,000 with a student population of 35,000 for a ratio of 3.0, and is within commuting distance of Denver).
I view the most important outcome of the taxonomy I created is that it makes it clear that we need to move on from the myth that Davis is the small stand alone college town like Pullman. We cannot compare ourselves to them (just like we can’t be compared to Palo Alto) because we’re not like them. There isn’t a dichotomy of “college town” vs. “urban center”–there’s more dimensions that influence the appropriate composition of a college town and we must acknowledge that when we plan for our future.
Thank you for that clarification Richard. I agree with your focus on the fourth group, and thank you again for the four-part taxonomy.
Having relatively recently gone to Ann Arbor for a wedding, I have a vivid image of it that is very far removed from my image of Davis. The hotel I stayed in had 14 floors and 207 rooms, but that was small compared to Tower Plaza the , 26-story condominium building located between the University of Michigan campus and downtown.
Ann Arbor is 43 miles from Detroit and is its own SMSA according to the US Census. Placerville, and Auburn a Yuma City and Fairfield and Lodi are all within 43 miles of Sacramento. Would you consider any of them as Sacramento suburbs?
I will do a jobs analysis of Ann Arbor later this evening and post the results when I do.
Fort Collins is 64 miles from Denver. What city do you think Fort Collins is a suburb of?
Boulder is only 30 miles from Denver. There you have a possible example.
Matt,
The City has employees commuting from Shingle Springs and Marysville. The commute traffic to Auburn is substantial. Seems that 40 miles is considered feasible.
The Faculty and Staff residence spreadsheet provided to me on March 23, 2023 by UCD’s Budget and Institutional Analysis Department shows:
25 Faculty and Staff out of 11,600 from Auburn
6 from Shingle Springs out of 11,600
None from Marysville
I’d retitle this (and all of the growth advocacy articles) as, “The Vanguard’s usual growth activists continue their desperate search for problems in support of their proposed solutions.”
And if you expand that red “city boundary” that accompanies this article out far-enough, you can label everything in Yolo county as “infill”.
Meanwhile, Davis will probably have to “tear down” some houses when Genentech closes. 🙂
This is getting quoted my summary article… Spot-on.