Part 1 – Recent Salary Increases to the City Manager
On July 9, 2024 the Davis City Council approved a 2.0% increase in base salary for the City Manager, Mike Webb. This salary increase was made retroactive to January 9 of this year. He was also awarded a retroactive bonus of 3.0% for 2023 and another 3.0% bonus for 2024.
The ostensible reason given for the 2.0% raise was that Mr. Webb’s 2023 salary was 2.8% LESS than the median salary earned by City Managers in nearby cities, and thus a raise was appropriate to keep Mr. Webb’s salary competitive. However, the Council based the City Manager’s salary increase on misleading data.
Mr. Webb’s salary was compared with City Managers in twelve purportedly “comparable” local cities in the region. However, half of those 12 cities are much larger than Davis, and include Sacramento (population of 525,000), Roseville (population 190,000), and Fairfield (population 119, 000). Davis’ population is only about 67,000.
An Alternative Fair Comparison with Comparable-Sized Cities
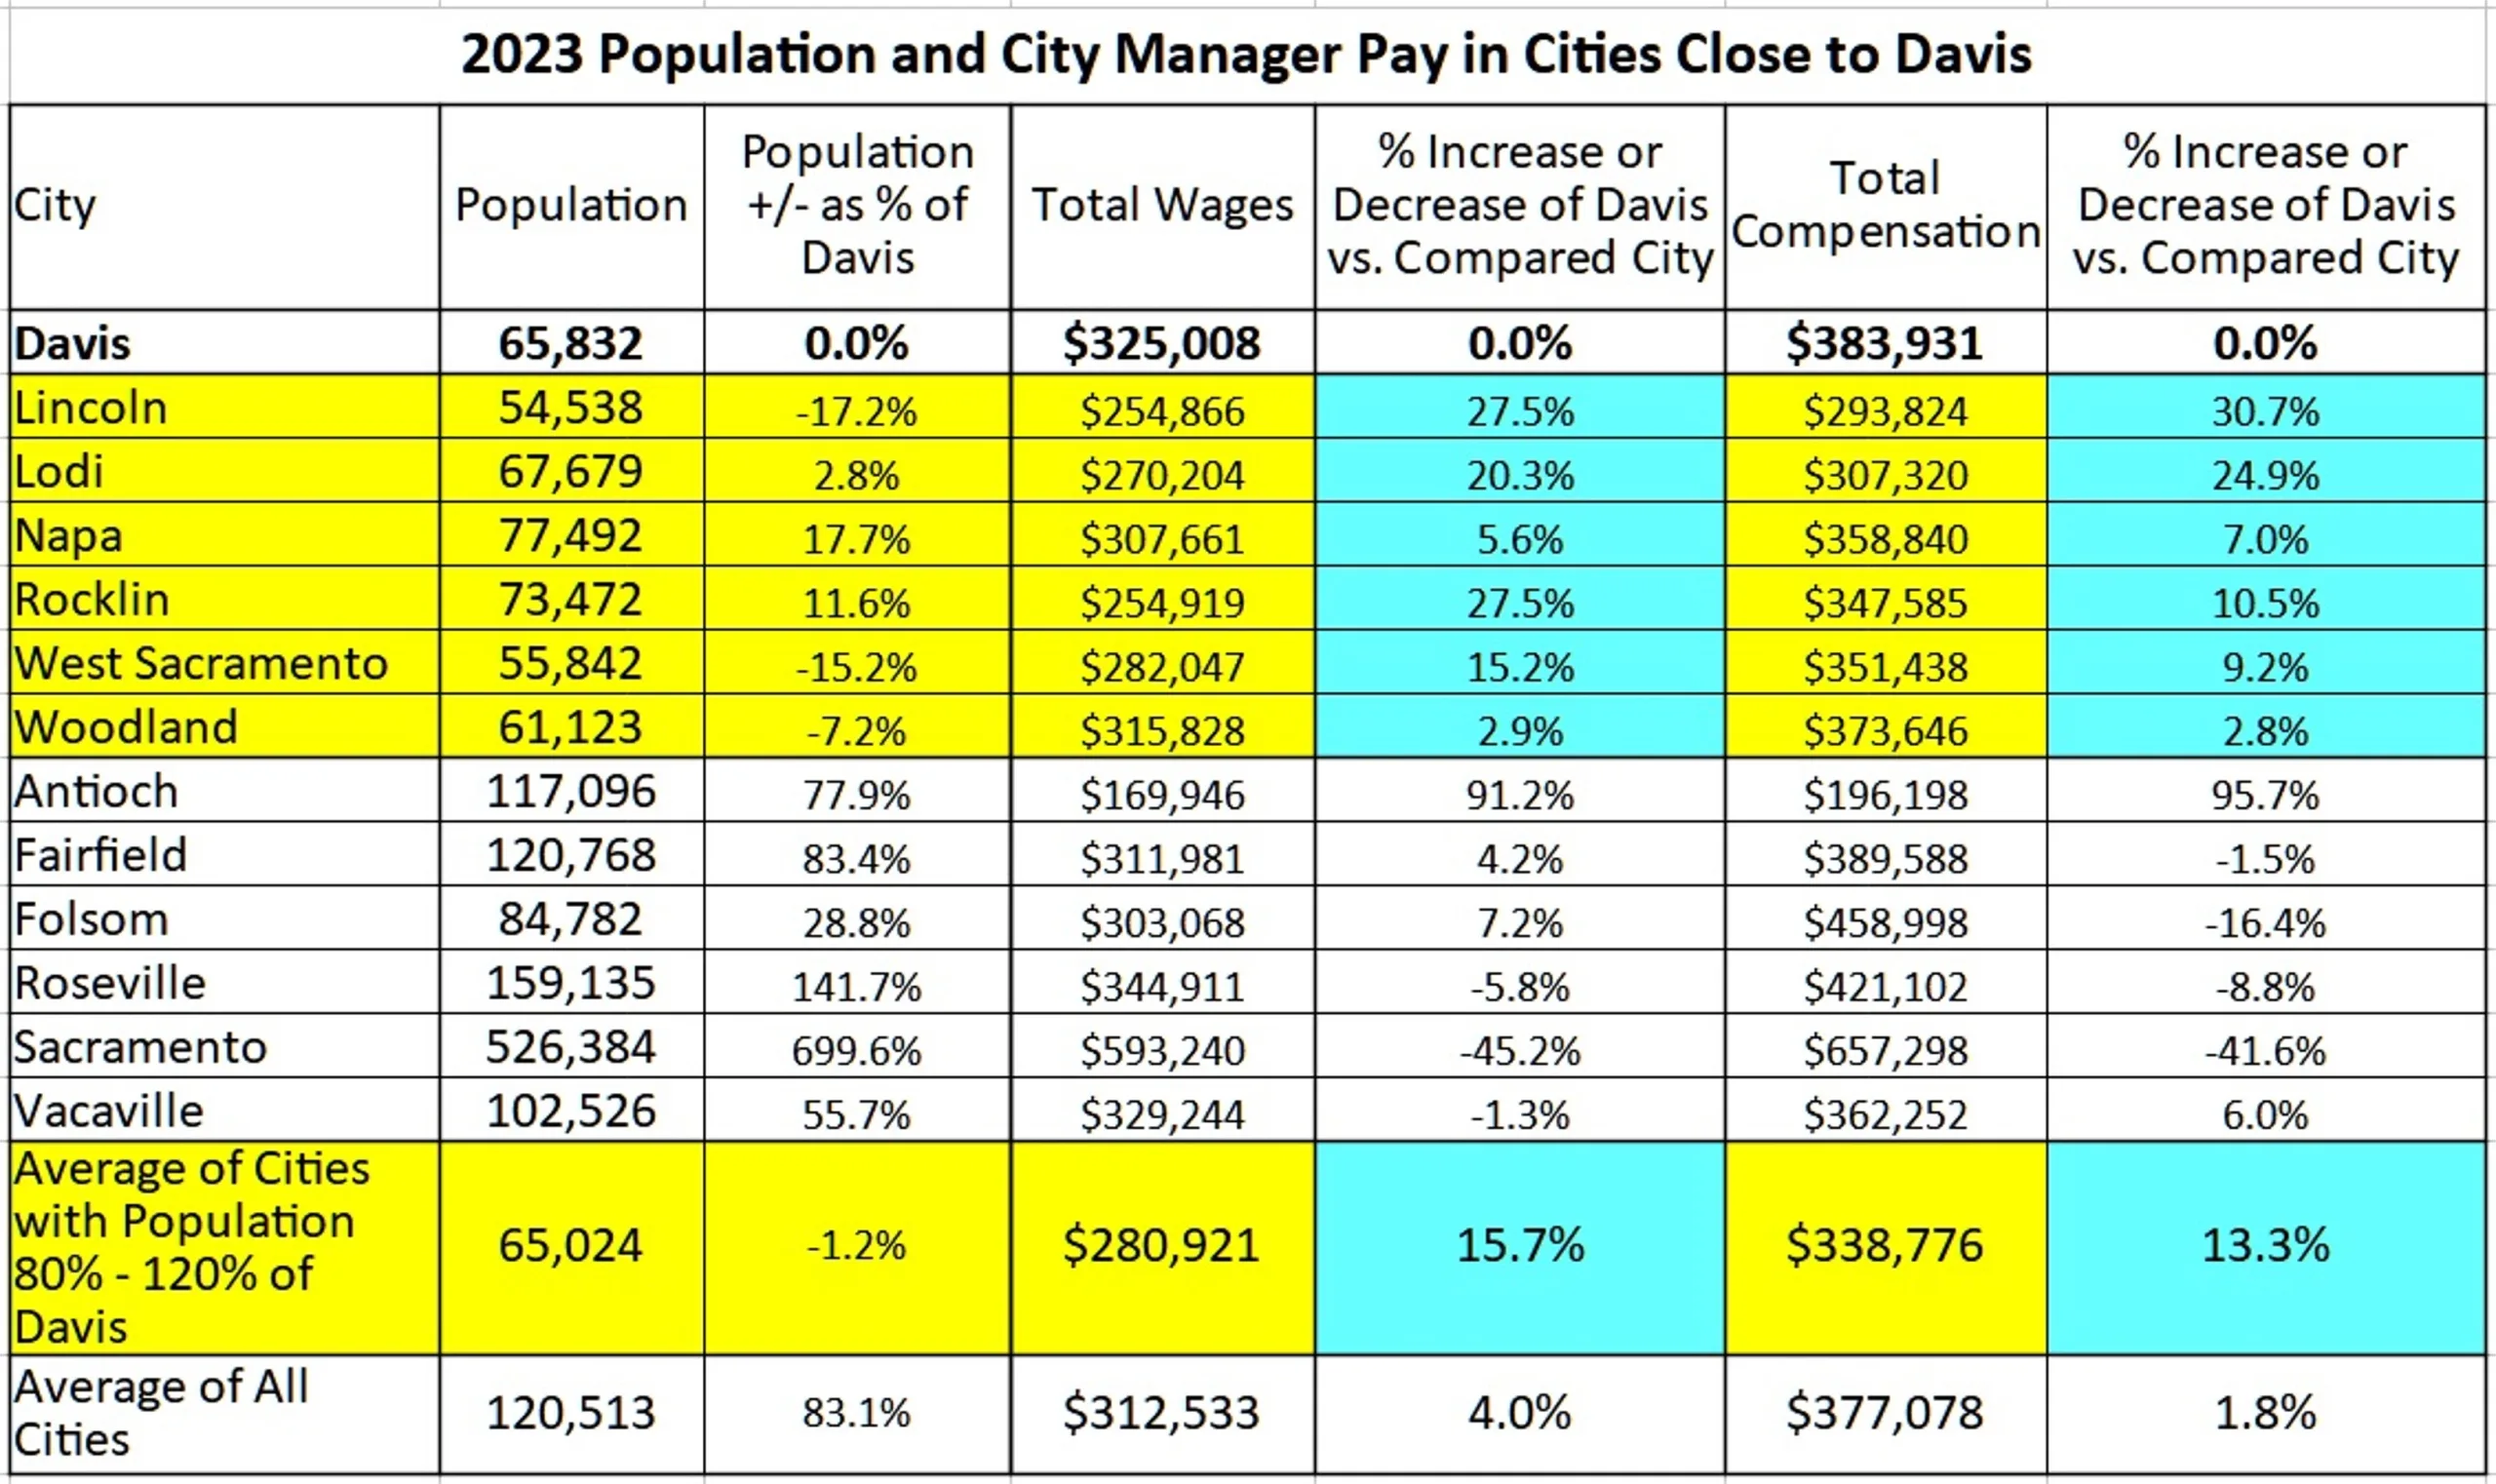
If City Manager compensation data is used from the 6 truly “comparable”-sized cities (that is, cities with a population +/- 20% of Davis), Mr. Webb’s 2023 salary is as much as 30.7% GREATER than the City Managers in the six comparable-sized cities. (Lincoln, Lodi, Napa, Rocklin, West Sacramento, and Woodland—see Appendix 1)
Further, the Council did not include in Mr. Webb’s comparative 2023 salary, the fact that he was retroactively awarded a 3% “performance bonus” for 2023 and for 2024 (even though the year isn’t even over). When this “performance bonus” is added to his 2023 base salary, Mr Webb’s compensation was even further in excess of all comparable-sized cities in the region. Thus, the basis of comparison in regard to Mr. Webb’s salary increase was seriously flawed.
What makes things worse, Mr. Webb was granted these “performance bonuses” despite the abysmal state of the city’s budget, with no audit of the city’s financials since 2021, a general fund reserve that is half what it should be, and the fiscal situation so desperate it required reducing funds last year for road repairs by $1.5 million and suspending paying down the $42 million debt for unfunded employee benefits.
Conclusions
The recent granting of excessive salary increases to all City of Davis employees was based, in part, on comparisons of salary/compensation of employees that included much larger cities rather than limiting the salary comparisons to comparable-sized cities. As a result, Davis City employees enjoy a substantial salary advantage compared to employees of similar sized cities, and the resultant recent salary increases ostensibly given to keep our employee compensation “competitive” were not necessary at all.
In the coming part 2 of this series, we will explore how this same reliance on misleading data resulted in a salary increase of 6% (retroactive about 1 year) to ALL Davis City firefighters when they were already earning an average of from 1% to 9% higher than in comparable sized cities.
Appendix A
Actual Salary Comparisons of Davis Employees with Comparable-Sized Cities
Regrettably, none of the raw data used to perform the calculations displayed in the compensation study were contained in the Staff Report for this matter, so these reported results could not be replicated.
However, all public employees’ salaries are reported to and can be downloaded from https://publicpay.ca.gov/. In this manner the 2023 populations and compensation information of the
City Managers for each of the twelve, purportedly comparable cities above were downloaded and inserted into a spreadsheet for analysis which results are summarized below.

Alan –
As I read this you are making the claim that “the Council based the City Manager’s salary increase on misleading data” and that the comparable cities used by the consultants are “inappropriate.”
But the only data your site is population size.
You show no record of talking to the consultants who did this study.
That seems to be a rather glaring omission.
Here’s a question: why would you pay for consultants if any old dork with a spreadsheet could do the work? And before you answer in the affirmative, shouldn’t you know the actual scope of work before you evaluate the final product?
David, aren’t those questions you are asking Alan, the kind of mquestions that trhe Council should be transparently be providing tom the citizens? Why did they include cities where the span of control and responsibility was/is so much greater than in the City of Davis?
These are questions that the Vanguard used to ask when it was a young blog. Why doesn’t the Vanguard ask these kinds of difficult and probing questions any more?
Maybe, but if someone publishes an article, they have an obligation to do their homework.
Here’s a link to the compensation study, by the way: https://documents.cityofdavis.org/Media/AdministrativeServices/Documents/PDF/ASD/Human-Resources/2023%20City%20of%20Davis%20Total%20Compensation%20Study.pdf
Another typical sleazy hit piece from no on Q. This study makes no accounting for how long the city manager has worked in Davis. Mike Webb has worked in Davis for many years and served as CM for I think around a decade. The average tenure of a CM is much shorter.
Ron, that is meaningful because?
Can yu name a single achievement of the City of Davis in the last 10 years that was the result of proactive planned-out leadership that accomplished the stated goals that the achievement was designed to accomplish on time and under budget?
The respite center.
That wasn’t proactive. It was reactive.
It wasn’t forward looking.
Off the top of my head
Jump bikes
Access to youth sports by underprivileged kids
Olive drive pedestrian over crossing
South Davis library
Sunday craft market
2nd Friday art about
Food trucks
U mall remodel
Capture of Marsh and Dominguez
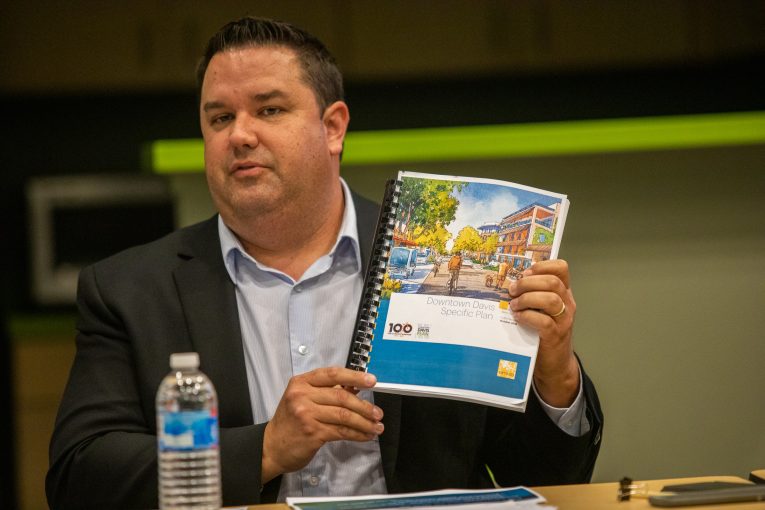
The downtown plan
There are ten off the top of my head
Arts grants
Natalie Corona memorial
Public pianos
Interesting list Ron.
Jump bikes – On time and under budget? Has the jump bike service been continuous, or has it had significant interruptions in service? Was the Jump Bike program a proactive idea of the Council, or a reactive idea due to a vendor initiative?
Access to youth sports by underprivileged kids – Can you point me to the plan for this project on the City website … and the annual budget? I plead ignorance on any of the details of this program. Was it a City idea or a DJUSD idea or a youth sports league idea?
Olive drive pedestrian over crossing – On time and under budget? You have to be kidding!
South Davis library – First it is a County project. Second it is close to 30 years behind schedule
Sunday craft market – I’ll give you that one. What is its annual budget? How often does it meet? How is the City involved?
2nd Friday art about – That is another one I will give you. What is its annual budget? Was it the City’s idea or John Natsoulas’ idea?
Food trucks – Proactive? Annual budget? City’s idea or the Truck owners’ idea?
U mall remodel – Proactive or reactive? Who brought the project forward? On-time and under budget? Housing units included?
Capture of Marsh and Dominguez – Proactive or reactive? On time? Under budget?
The downtown plan – On time? Under budget? Being used? Creating fewer vacancies? Delivering? Economic Development?
Arts grants – <On time? Under budget?
Natalie Corona memorial – Proactive or reactive?
Public pianos – Another one I will give you. What is its annual budget? Was it the City’s idea or the idea of a local musician?
Healthy Davis Together – This was a clear win for the community, and we should all be proud of what was accomplished. However, it was clearly reactive rather than proactive, and it was much more a UCD project rather than a City project. But again, definitely worth celebrating. Do you know why/how it ended?
The city also got enough apartments built to increase the vacancy rate to an almost balanced rental market
It was the University who built the vast amount of apartments in West Village that took the pressure off of the housing market and not leadership by the CM or City Council.
As far of the rest of your list, almost all are “nice to have” not “need to have”.
Let’s talk about the “needs to have” that there were abject failures.
1. Road maintenance and infrastructure maintenance – Grade = F
2. Paying down our long term debt to CalPERS – Grade = F
Let’s look at some of our big infrastructure projects:
1. Mace Mess – Grade = F
2. F. St & Covell – Grade = F
3. G. St Redesign – Grade = F
And even if you look at your list of wonderful, award-winning accomplishments, most were way over budget and interminable in length. In particular, the 5th St Respite Center on which the City spends over $1 million per year (not counting the capital costs almost pushing a milllion) to serve about 15 people a day on average => $66,666 per average daily visitor = $183 per average daily visitor! Instead of the Respite Center, we could get them all a hotel room and feed them 3 square meals a day and have enough left to give them $75/day in cash. How is that somehow a ringing endorsement of an accomplishment of the City? Just giving the money to a non-profit devoted to homelessness would be a far better use of the money.
Project Roomkey: https://www.cdss.ca.gov/inforesources/cdss-programs/housing-programs/project-roomkey
Healthy Davis Together
Which ones are only nice to have?
“Reactive” = responsive. That’s council members doing what they’re expected to do.
“Proactive” means council members would be initiating things that may or may not have public support.
Don, I don’t disagree, but fighting fires is only part of their job. They should be leading the community into the future that the community wants. In our current case, there has been absolutely no effort made in the last 15-20 years to gat any understanding of what the future is that the community wants.
As I have previously noted Mayor Chapman said the following at the LWV Forum on Measure Q, “Davis people want to look forward and move the community in a different direction.”
That statement has two significant challenges/flaws, both of which are fixable. The first challenge/flaw is that neither Mayor Chapman, nor any of your fellow City Council members have articulated what that “different direction” is.
The second challenge/flaw is that despite the rhetorical reference, the Davis people haven’t been consulted on what that different direction might be.
I’m not sure that Mayor Chapman himself could give a description of what that different direction might be.
It bears repeating that the job of the Council isn’t just to fight fires.
The university gets credit for building student housing but to say that the apartments built in the city didn’t help shows a lack of understanding of basic economics.
My piece on healing Davus gives a number failure of city government in ways that transcend any one council capability— ie responsiblilty city manager.
I am surprised David gives city manager complete pass on addressing structural deficit. Or hype we “fixed road” maintenance funding in 2022.
Or zip line . $400k shade structure or neglect of trees esp in our downtown/ (remember a woman was killed by a tree in one of our parks). The community-input-free process on I-80 that ignored chance for meaningful input from Uc davis experts from ITS until it was too late.
Culture of city staff that has rejected a community collaboration mind set with stakeholder has bread deep distrust.
Mike has a narrow range of experience outside Davis , and I hardly would say city is doing well— but no one is ringing alarm bells.
Council want to believe it’s all good too so they are hardly likely to now want to reward Mike. That would be cognitive dissonance.
We need some soul searching. While city council and staff has to lead in this, I included the on O folks too in the “ We”
Our culture of governance not working .
Can we get beyond blame game and figure out how to collaborate?