By Matt Williams
 With apologies in advance to those people who find my articles and/or comments too detailed, I’m going to clearly show David the numbers, so that he, and hopefully everyone, understands the traffic study contents.
For those of you who want to skip the detail and just read the summary, it appears at the bottom of the article alongside the very tall Google Earth image of Mace and its current lane configuration.
With the caveat that the readers of yesterday’s article don’t know what steps might have happened behind the scenes that weren’t described in the article, it appears that yesterday, David Greenwald forgot to follow his own advice. Several times in the recent past David has complained bitterly that one of the Vanguard’s guest writers published their article without taking the time to check with an information source prior to publishing an article that criticizes one or more aspects of our community’s decisions and/or decision processes. I believe, but could be wrong if there is information I don’t know about, David would have done well for himself and for the Yes On Measure H campaign team if he had checked with the information source he criticized in yesterday’s article. If he did do so, I’m sure he will clarify in a comment.
Traffic studies are arcane beasts. They follow a set of clearly set out rules that a lay person like David and me has to work hard to understand. It is easy for a lay person to make mistakes when trying to understand “WHY?” a traffic finding in the traffic study is what it is. In late 2020 when formally submitting questions about the traffic study in the Draft EIR, I learned that lesson the hard way. To their credit Fehr & Peers responded very clearly, logically, understandably, and professionally to my questions … pointing out where I had gone wrong in my calculations. They were good teachers. I thank them for that educational lesson.
So, when the updated traffic study for DiSC 2022 was published I was able to much better understand the data … and also carry forward the intersection by intersection graphics that had accompanied the 2020 traffic study. However, before I finalized any conclusions based on the new data, I reviewed those tentative conclusions with a retired City traffic engineer and two engineering professionals who have considerable experience dealing with traffic. Their collective and individual counsel was very valuable. Their advice would have been very helpful to David if he had sought that advice prior to publishing yesterday.
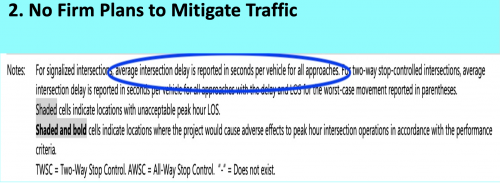
The image below is the first slide in my presentation to the Realtors and Chamber that David took exception to yesterday. The white portion of the slide is a direct screen shot from the Fehr & Peers traffic study, with the blue highlighting added by me. It appears in Table 4 on page 23 of the document.

What does the language of the Notes mean? It means each intersection is evaluated in aggregate. In the case of the Mace-Alhambra intersection, “in aggregate” means the weighted average of the four directions, northbound, southbound, westbound, and the future eastbound. Since I didn’t know what “weighted average” meant in this context, my retired City traffic engineer friend explained it to me. And the table below shows the weighted average calculation for the Fehr & Peers data for the existing conditions at the Mace-Alhambra intersection for the PM Peak Hour, during which 1,746 total vehicles were counted. 38.6% of them were southbound. 49.3% were northbound. 12.1% were eastbound. 0% were westbound. Those percentages change when the project volumes are added because there is real westbound traffic coming out of the project.

So hypothetically if mitigations are implemented that have no effect on southbound, no effect on eastbound, and improve northbound buy a factor of 2, then the “weighted average” improvement would be by a factor of 0.986, which is 49.3% times the northbound improvement of 2.
 NOTE: the Fehr & Peers computerized model is more complex than this illustration, because it includes both “before” and “after” weights.Now let’s look at the mitigations/improvements that impact the Mace-Alhambra intersection. Those are:
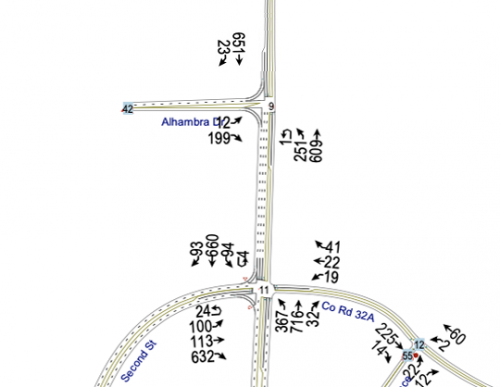
The Fehr & Peers graphic of those PM Peak Hour traffic volumes looks like this >>>>>
#1 Add a second northbound lane on Mace Boulevard between Second Street and Harper Junior High School (Mitigation Measure 3-70(a))
#3 Add a second southbound lane on Mace Boulevard between Alhambra Drive and Harper Junior High School (Mitigation Measure 3-70(a))
#4 Construct a Class 1 shared-use path on the inside of the Mace Curve (Mitigation Measure 3-75(a))
and
#2 Improve bicycle facilities on Mace Boulevard (MM 3-75(c))
#6 Improve bicycle facilities on Alhambra Drive (Mitigation Measure 3-75(c))
#7 Improve bicycle/pedestrian crossings at Mace Boulevard/Alhambra Drive (Mitigation Measure 3-75(c))

Before discussing the improvements in traffic flow those six mitigation measures will yield, it is useful to see what the intersection volumes will be with the addition of the project. Those incremental additions reported by Fehr & Peers are the red numbers in the graphic.
Here too I have highlighted the important information. The project sends 190 vehicles north on Mace and 156 vehicles south on Mace. It also is going to result in more signal changes of the Mace-Alhambra traffic signal to accommodate the 72 southbound vehicles turning left into the project from Mace, as well as the 64 vehicles coming out of the project and proceeding thru on Alhambra. Bicycle and pedestrian crossings of Mace at that intersection will increase over the current near-zero level, causing further traffic signal cycle delays for both and southbound Mace traffic.
It is also worth noting (as I did in my presentation to the Realtors and Chamber) that in addition to the 156 added vehicles joining Mace southbound at Alhambra, there are a further 243 added vehicles joining Mace southbound at Ikeda’s. With the 12 added vehicles coming off Second Street, that is over 400 additional vehicles heading south on Mace to the Elephant in the Room … the I-80 Eastbound onramp … more on the impact of that Elephant later.
Now let’s look at the six mitigations, and how they impact the traffic at the Mace-Alhambra intersection. #2, #6 and #7 will have minimal impact on motorized vehicle traffic on Mace, since they are all focused on bicycle facilities and bicycle/pedestrian crossings. For much the same reason, #4 will also have minimal impact on motorized vehicles. That is especially true in the PM Peak Hour traffic jam since the southbound vehicles on the Mace are crawling along at a much slower pace than the bicycles using the shared use path.
 So that leaves us with #1 and #3. The northbound lane addition is very likely to improve northbound travel times. As the graphic to the left shows, northbound Mace is only one-lane wide as it approaches Alhambra, having squeezed down from two lanes to one lane across from University Covenant Church between Second Street and Alhambra. Adding a second northbound through lane from Second all the way through the Mace Curve will mean the 609 existing northbound thru traffic vehicles plus the 34 northbound thru traffic vehicles added by the project will be able to proceed two at a time. Multiply that improvement times the average weighting factor of 49.3% and you have a “real” number.
The problem with that improvement is that northbound Mace doesn’t really have any meaningful congestion delays during the PM Peak Hour.
The southbound lane addition is a different story. If improvement #3 actually added a southbound lane for thru travel at Alhambra, one could argue that there is potentially some improvement. However, as the graphic on the left clearly shows, Mace already has two southbound thru lanes at the Alhambra intersection. So adding the additional southbound lane around the mace Curve will do absolutely nothing to improve the thru capacity of southbound Mace at the Alhambra intersection.
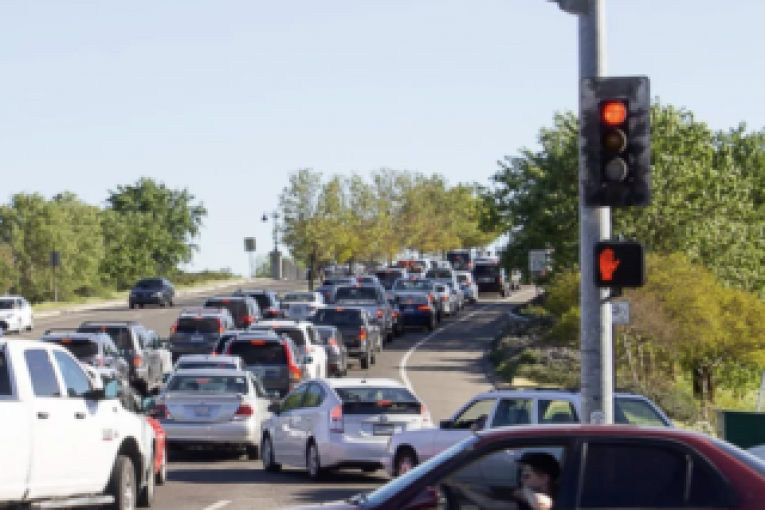
Further, as the traffic picture at the very beginning of this article clearly shows there is another problem for southbound Mace traffic at Alhambra. It is backed up bumper to bumper, and the 156 vehicles that Fehr & Peers has projected will be coming out of the project and trying to turn left on southbound Mace will experience similar challenges like the cars coming out of the right size of that picture trying to merge into the backed up Mace traffic.
So, there will be no meaningful improvement southbound achieved, and when you multiply the zero improvement times the average weighting factor of 38.6% you get a value very close to, or equal to zero.
Add northbound’s real improvement to southbound’s zero improvement and you get an “aggregate improvement” for the intersection as a whole from the traffic engineering viewpoint, but no actual improvement for the Davis residents stuck int the southbound traffic jam.
That is what David Greenwald would have found out if he had followed his own advice prior to publishing his article yesterday.
In summary:
— David Greenwald and I disagree on whether DISC will “improve” traffic on Mace (see his article HERE)
— The traffic study does say it will
— This conflict is because the congestion on Mace north of I-80 is asymmetrical; southbound only
— Because the models report average changes, widening Mace north of Alhambra results in an average improvement despite more traffic coming from DISC
— But the issue is southbound congestion
— Mitigating a substantial portion of the congestion on both southbound Mace above I-80 and northbound Mace below I-80 (in the “Mace Mess” area) requires Caltrans to discourage freeway traffic from bypassing using Davis streets (see Peter Jacobsen’s Vanguard article Guest Commentary: Fixing the Mace Mess the big picture by taking steps to:
.
…..(1) Speed up the I-80 freeway by streamlining the CA-113 interchange
…..(2) Make Mace less attractive as a traffic bypass to users of Waze and other phone nav apps by removing (or metering) the two Mace onramp carpool lanes
The reason that last point is so important is that it goes to one of the roots of the congestion problem and keeps the nav app users from ever finding that using Davis streets is faster than staying on I-80. The problem is that if one nav app user finds that using Davis streets saves time, then the apps will direct hordes that way. Those hordes will overwhelm the on-ramp capacity and jam Mace both north and south of I-80.
BUT, if that first user finds they can’t zip back onto the freeway, and have to sit in a queue, then their travel time on the app will be increased enough that the apps will keep folks on the freeway. That is a Win-Win for Davis!
