 According to the Legislative Analyst’s Office (LAO) report that we released this year, showing state spending at a record low while the recession is the primary cause of California’s Budget deficit. In addition, the California Budget Project’s report shows a huge growth, not surprisingly in state spending on corrections over the past two decades.
According to the Department of Finance, state spending per $100 of personal income is at its lowest level in nearly 40 years. Under the Governor’s May Revision, General Fund spending, adjusted for inflation would at the lowest per capita level since 1993-94. And as a percentage of personal income, state spending in 09/10 is at its lowest level in more than a decade.

Since 2006, personal income growth has steadily fallen; and in 2009, personal income shrunk for the first time in the post-World War II era. Wage and salary employment is expected to stay negative through 2010.
We have spent a good amount of time analyzing the city of Davis’ budget situation and focused heavily on city employees who draw on roughly 71% of the general fund spending.
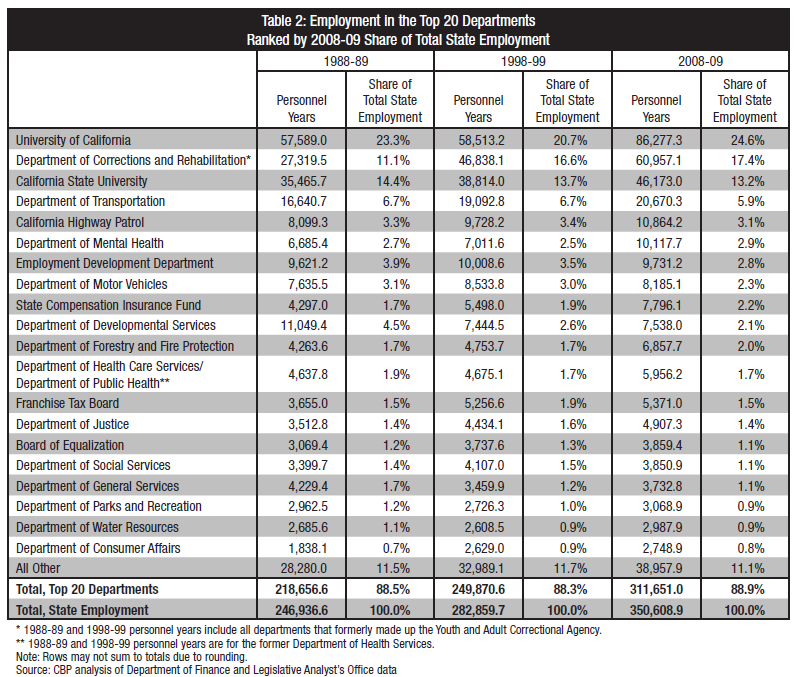
Likewise at the state level, many have looked toward state employees and argued the state could balance its budget simply through a reduction of state employees. The California Budget Project (CBP) analyzed California’s employees and found that 60% were employed by either UC, CSU, or the Department of Corrections.
The CBP study found that The University of California (UC) and the California State University (CSU) account for more than one-third of state employment. More than one-third (37.8 percent) of all state employees worked in higher education in 2008-09.
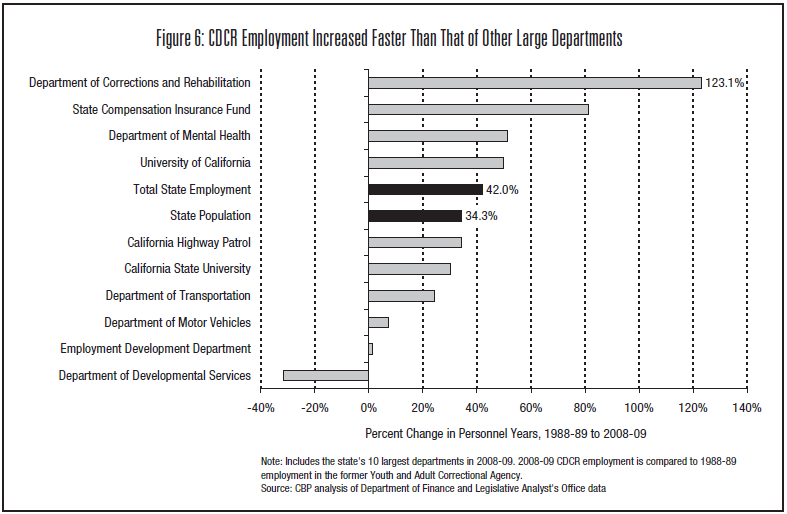
The culprit in the last twenty years for growth in the government sector is corrections. The Department of Corrections and Rehabilitation (CDCR) is now the second-larger state employer, employing one out of six state workers (17.4). Not only did CDCR go from the third-largest department in 1988-89 to the second-largest in 2008-09, but it grew at four times the rate of the rest of the state employment over the same period – 123.1 percent compared to 31.2 percent.
Moreover, CDP found that “excluding corrections, state employment lags population growth. California employed an estimated 9.3 state workers per 1,000 residents in 2009-10, slightly more than the 8.7 state employees per 1,000 residents in 1988-89. When CDCR employees are excluded, the number of state employees per 1,000 residents actually decreased from 7.8 in 1988-89 to 7.6 in 2009-10.”
In another discussion, it will be helpful to show the impact of the powerful CCPOA in terms of the increase not only salaries for correctional peace officers, but also in the rise of mandatory sentencing laws which have forced jail populations to soar and with them, the spending on the department of corrections.
For our purposes here, it suffices us to point that when most people think of state employees, they are probably not thinking of UC Professors and prison guards, but that is the bulk state spending on employees.
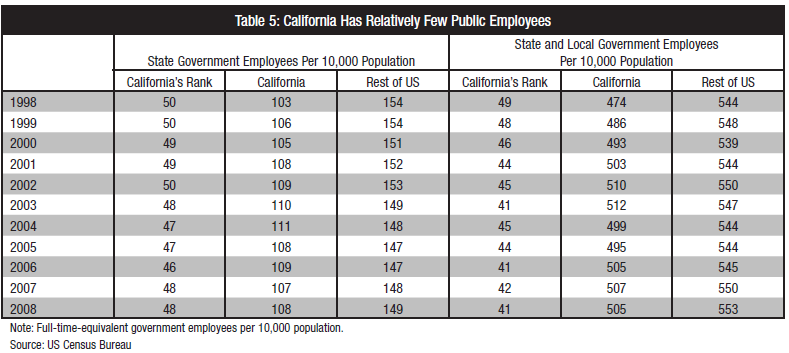
However, it is also worth noting that California actually rates near the bottom in terms of state government employees per capita. The most recent available figures are only from 2008, but suffice it to say things have if anything declined further since then, California had 108 state government employees per 10,000 people living in the state, that ranked 48th and the average of 149.
Moreover, California ranked 41 in state and local government employees per 10,000 people living in the state, at 505 compared to the national average of 553.
Now this does not break down the spending compared to the rest of the nation, but in terms of size of Government California is far from the top.
—David M. Greenwald reporting


DPD: “Moreover, California ranked 41 in state and local government employees per 10,000 people living in the state, at 505 compared to the national average of 553.
Now this does not break down the spending compared to the rest of the nation, but in terms of size of Government California is far from the top.”
If CA ranks as a state that has fewer state and local gov’t employees than many other states, and CA has one of the higher tax rates (income tax; sales tax; other misc. taxes) than any other state, then why is CA in deeper economic trouble than most states? Something doesn’t seem to quite add up here…
“If CA ranks as a state that has fewer state and local gov’t employees than many other states, and CA has one of the higher tax rates (income tax; sales tax; other misc. taxes) than any other state, then why is CA in deeper economic trouble than most states? “
Well first that would suggest that all the money does not go to employees.
Second, from what I’ve seen, though different people point to different measures, the tax rate is not that much higher than other states.
This is the rank comparisons on taxes for California versus the US from the California Budget Report: link ([url]http://www.cbp.org/pdfs/2009/0902_Californias_Tax_System.pdf[/url])
[i]”CA has one of the higher tax rates (income tax; sales tax; other misc. taxes) than any other state, then why is CA in deeper economic trouble than most states?”[/i]
Talk to Paul Laffer ([url]http://en.wikipedia.org/wiki/Laffer_curve[/url]), Elaine.
Laffer Curve….We’ve passed the rate of taxation where California taxpayers feel it’s not worth working too hard to earn extra income because Federal and State taxes eat away too much of our wages or people have just decided to move to a more tax friendly state.
David has pointed out an important issue.
Our public spending on actual services to the public – whether its healthcare for the needy or education or infrastructure, is not particularly high.
Yet our public employees are among the highest paid in the nation.
Our teachers, prison psychologists, managers, planning clerks etc are in the top 5, if not number 1, in salary in many cases.
Because we pay them too much we can afford neither the number of employees we need, nor the amount of services we should be providing.
And what is the evidence that the pay is too high? Well, when an advertised job attracts hundreds of applicants then that is a sign that the job could be filled at a lower pay rate. Recent studies show that public employees are making twice what their private sector equivalents are getting. That’s not “comparable worth”.
And why can they get away with it?
1. Politically savvy public employee unions control the political process.
2. Many voters still have a naive view of today’s unions, particularly public employee unions.
3. Many costs are hidden in extensive benefits, no penalties for poor performance, abuse of sick time, overtime and vacation benefits etc.
I’m not ready to conclude that JR. Certainly for corrections officers we are paying way too much plus the enhanced retirement. But I have never really seen a state-by-state comparison that controls for cost of living. I mean I would expect us to pay teachers more in California than Mississippi for instance because the cost of living is far higher. What is also missing is the actual money we spend as a percentage of our GDP and our budget that goes to pay for salaries.
I don’t want to pick on teachers. They are not as overpaid as other state employees, and they work much harder, generally. There are many places in the state budget where one can find inefficiencies and gross misallocation of funds, but the teachers are doing a very demanding job reasonably well given the crazy conditions that voters and unions have pushed upon them.
However facts are facts:
Even adjusted for state income, the data shows CA teachers are more highly paid than those in other states.
http://www.employmentspot.com/employment-articles/teacher-salaries-by-state/
“The state with the highest average teacher salary was Connecticut, at $57,760. California was a very close second, where the average teacher salary is $57,604. New Jersey teachers make approximately $56,635 per year. Rounding out the top five were Illinois and Rhode Island, with the average teacher salary at $56,494 and $56,432, respectively. The state with the lowest average teacher salary was South Dakota, at $34,039.”
In both median household income and per capita income,
California ranks ninth
http://www.census.gov/compendia/statab/2010/ranks/rank33.html
DMG: “Second, from what I’ve seen, though different people point to different measures, the tax rate is not that much higher than other states.
This is the rank comparisons on taxes for California versus the US from the California Budget Report: link”
According to the report you linked me to, inre tax revenues as percentage of personal income, CA income tax rate is one of the highest in the nation (#4) at about 1.5 times the nat’l average; state corporate income taxe rates are also one of the highest in the nation (#6) at about 1.6 times the nat’l average; and state tax rates are fairly high (#14) at about 1.2 times the nat’l average.
Again, if CA has fewer employees than many other states, then where the heck is all that tax revenue going? One logical conclusion one can come to is that CA workers are being paid far too much in salary and benefits relative to other states? Or perhaps there is some mysterious bureaucratic vortex that is sucking up the tax revenue? For instance, it came out in the news that a top CA legislator gave his top aid a big fat raise during this economic downturn, so the aid was making $190,000 a year. Also, even if CA has fewer workers, it could also be possible CA provides more services – it just outsources the work? I’m really searching for answers for the anomaly – higher taxes, fewer workers, but the state is in one of the worst economic shapes of any other state. Something does not add up…
“Again, if CA has fewer employees than many other states, then where the heck is all that tax revenue going?”
The tax revenue has severely declined over the past three years, hence the need for budget cuts.
Paul Krugman had a tangentially related article on this yesterday:
[url]http://krugman.blogs.nytimes.com/2010/06/06/lost-decade-here-we-come/[/url]
That the lack of will for further federal stimulus spending will depress the economy in coming years.
J.R. — I’ll have to dig up the source a little later, but the California K-12 system also already operates at one of the lowest staffing ratios of teachers to students (even before the recent state budget cutting), as well as at one of the lowest staffing ratios of administrators to students in the country. When other states address their own issues of having too much “fat” in their public education system, they look at the low staffing ratios of California as an example to emulate.
Anyway, if you have to deal with more students than your colleague in the next state, don’t you think that you should be compensated in an equivalent fashion?
Here’s the reference:
p. 47, Gordon, Tracy M., et al., 2007, “Fiscal Realities: Budget Tradeoffs in California Government”; Public Policy Institute of California, 243 pp.
[url]http://www.ppic.org/main/publication.asp?i=578[/url]
wdf1: your reference from the Public Policy Institute of California shows that per capita spending on education in CA is not too far above average for the states.
But it also shows that per capita spending on government administration is way above average.
Also way above average is per capita spending on social services.
The real problem with government spending however is its inherent tendency towards corruption. Government behaves much like a big monopoly corporation. An HMO with no competitors. It is incredibly wasteful of spending.
One local example I heard about was from a contractor who was building a drainage system for a public works project for a local county. He had two equally valid options on how to proceed, but was directed to use one that cost two million dollars more. He strongly recommended the cheaper alternative as preferable, but was ignored. This resulted in tremendous amounts of unneeded trenching, filling and laying of concrete. The advice of skilled engineers was overridden by civil servants with no understanding but unchallengeable authority. The costs went to taxpayers who had no idea where the money went. The motivation was a combination of ignorance, arrogance, disrespect for taxpayers, and perhaps (as he suspected) some kickbacks.
This kind of thing shows up as “higher construction costs” in California. It doesn’t show up as higher salaries or benefits, but it eats up tax revenue all the same. It is an unavoidable consequence of relying on government, and the best we can do is try to minimize it by limiting government and monitoring for corruption. Other states do this better than California.
J.R.: “But it also shows that per capita spending on government administration is way above average. Also way above average is per capita spending on social services…
…This kind of thing shows up as “higher construction costs” in California. It doesn’t show up as higher salaries or benefits, but it eats up tax revenue all the same. It is an unavoidable consequence of relying on government, and the best we can do is try to minimize it by limiting government and monitoring for corruption. Other states do this better than California.”
This is what I think is going on in CA…
J.R.:your reference from the Public Policy Institute of California shows that per capita spending on education in CA is not too far above average for the states.
Since 2007, education in California has taken bigger proportional hits than many other states. So if PPIC were to do another such survey in a year or two, per capita spending on education in CA might even be slightly lower than many other states.
The real problem with government spending however is its inherent tendency towards corruption. Government behaves much like a big monopoly corporation. An HMO with no competitors. It is incredibly wasteful of spending.
And do you think private industry, by comparison, is run by a bunch of saints? Banks? Pharmaceuticals? Oil companies? Chinese toy manufacturers?
A key difference is that we have a better chance to see how government operates than we do for private industry.
“And do you think private industry, by comparison, is run by a bunch of saints? Banks? Pharmaceuticals? Oil companies? Chinese toy manufacturers?”
Of course not. You misunderstand the basic tenet of free markets. Adam Smith pointed out that in pursuing their own interests people are led to benefit society, if a free market exists. Unfortunately, a lack of understanding of basic economics is prevalent today.
“A key difference is that we have a better chance to see how government operates than we do for private industry. “
Why is that? At least private industry is regulated. Who regulates government?
Smith also pointed out that business and government conspire together to limit competition. Each benefits from limiting freedom in various ways. It is the citizens and the consumers who suffer when governments and orporations get too powerful.
Why is that? At least private industry is regulated. Who regulates government?
In a democracy, the voters.