
By Matt Williams
Tuesday night at the City Council meeting I provided the following written Public Comment. To avoid blindsiding City staff, I delivered a copy of the issues to key members of staff … Dianna Jensen, Bob Clarke, Sherri Metzger and Mike Webb … via email on Monday.
.
-
- How are the 11,284 net new daily vehicle trips distributed through the hours of a typical day?
-
- The PM Peak Hour outbound net new vehicle trips in the Traffic Analysis only account for 35% of the EPS-reported total of 2,335 new employees, which begs the following question, “How are the remaining 65% getting to work?”
-
- “How did Fehr & Peers come up with the distribution of outbound commuting destinations it provides in the Volume 2 Traffic Analysis?” At a high level that means Fehr & Peers projects that approximately 22% of the PM Peak Hour trips will drive home from work to places within the Davis City Limits, another 23% will drive to places that could be Davis, but also could be beyond the Davis City Limits, 34% go east on Interstate 80, and 22% go west on Interstate 80. “Is that the expected distribution of DiSC employees used for the purposes of commute distances and GHG calculations?”
-
- Table B-12 of the EPS report reports that only 187 “Project Residents Assumed to Work Onsite.” That means only 40.6% of the 460 residential units will house a DiSC employee … less than that if any of the residences house more than one DiSC employee. “Are those numbers correct, and should they be made available to the Davis voters.” It is worth noting that the DISC 2020 project committed that a minimum of 60% of its housing units would be occupied by one or more DISC employee. The reduction from 6)% to 40% is both significant and meaningful.
I, and the Davis voting public, look forward to a speedy sharing of the answers to these important questions. Your leadership in making sure that goal is achieved by staff is very much appreciated.Respectfully submitted.Matt Williams—– Forwarded Message —–
From: Matthews Williams <mattwill@pacbell.net>To: Dianna Jensen <djensen@cityofdavis.org>; Bob Clarke <bclarke@cityofdavis.org>; Sherri Metzger <smetzker@cityofdavis.org>; Mike Webb <mwebb@cityofdavis.org>Cc: Zoe Mirabile <zmirabile@cityofdavis.org>Sent: Monday, April 18, 2022, 05:02:39 PM PDTSubject: Fw: E-mail to Dianna Jensen, Mike Webb, Bob Clarke and Sherri Metzger on Traffic Study – your thoughts and suggestions please
.Dianna, Bob, Sherri and Mike, I have done a deep dive into the DiSC EIR Addendum and the Davis Innovation & Sustainability Campus 2022 (DiSC 2022) Volume 2 – Traffic Operations Analysis in order to research the Yes On Measure H claim that “Measure H improves our existing trails, adds new bike and pedestrian paths, creates a safe under-crossing on Mace Boulevard, and reduces commute times near the Mace/I-80 interchange.”
.That deep dive has resulted in several questions that I have, the answers to which I believe will provide useful educational information for the Davis voters. Those questions are as follows:
.- The EIR says “According to Fehr & Peers, the DiSC 2022 project would generate 11,284 net new daily vehicle trips, with 1,052 trips occurring during the AM peak hour and 1,155 trips occurring during the PM peak hour.” A quick calculation shows that the two peak hours combined account for less than 20% of the 11,284 net new daily vehicle trips. The question that prompts is, “How are the remaining 9,000 trips distributed in the average day.?” An hourly graph similar to this one from Wisconsin would be a useful educational tool for the voters.

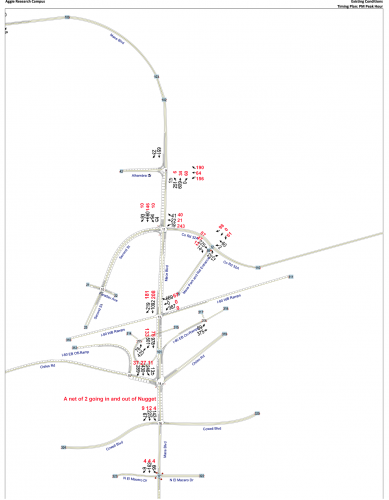
- Analysis of the data tables of the Volume 2 – Traffic Operations shows that the 1,155 PM peak trips are made up of 822 trips out of DiSC and 333 trips into DiSC. I have provided the Driveway-by-Driveway breakdown below. Given the EPS-reported total of 2,335 new employees, 822 outbound trips only represents 35% of the total, which begs the following question, “How are the remaining 65% getting to work.”

- A breakdown of the 822 outbound trips produces the following distribution of destinations. “How did Fehr & Peers come up with that distribution of outbound commuting destinations?” At a high level that means Fehr & Peers projects that approximately 22% of the 822 will drive home from work to places in Davis, another 23% will drive to places that could be Davis, but also could be beyond the Davis City Limits, 34% go east on Interstate 80, and 22% go west on Interstate 80. “Is that the expected distribution of DiSC employees used for the purposes of commute distances and GHG calculations?”

- And this last question is not specifically a Traffic question, but rather a Housing question with commuting implications. Table B-12 of the EPS report also reports that only 187 “Project Residents Assumed to Work Onsite.” That means only 40.6% of the 460 residential units will house a DiSC employee … less than that if any of the residences house more than one DiSC employee. “Are those numbers correct, and should they be made available to the Davis voters.”
Thank you for your attention to these important questions. I will be presenting the same questions to City Council tomorrow night, and wanted the four of you some time to do any background research and/or contact Fehr & Peers prior to the City Council meeting.
.The graphic below shows the Project only volumes (in red) added to the Existing volumes for the Peak PM period. The underlying graphic is from the 2020 Volume 2 – Traffic Operations Analysis


Back in April? Of what year?
Looks like it has an old caption on it.