
What happened? Drilling down into the Measure H and Measure B election data
by Matt Williams
Precincts
To get to an apples to apples comparison of the results of Measure H and Measure B, one has to start with the understanding that the Yolo Elections Office reported Measure H in two (2) consolidated precincts
… one for the western portions of Davis plus Downtown and Olive Drive (seen in light blue in the left graphic below), and
… the other for the northern, eastern and southern portions of Davis (seen in the darker blue in the left graphic below).
Back in November 2020 the reporting of Measure B came in eleven (11) consolidated precincts (rather than two), which are shown in the right side of the graphic below, with the precincts that had more than 50% “Yes” votes shown in green and the precincts that had more than 50% “No” votes shown in light blue.

Fortunately, the underlying precinct boundaries did not change between 2020 and 2022, so a one-to-on comparison of the two Measure H consolidated precincts can be made to their Measure B equivalents.
Turnout
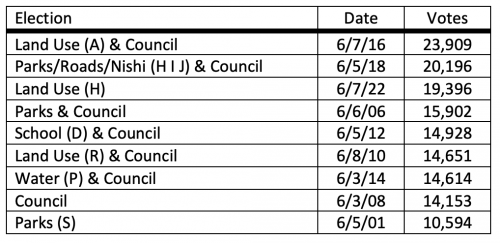
With very few additional votes to be counted, the Measure H vote total is 19,396, which is the third highest June turnout, behind only the two Nishi votes, and both those land use decisions shared the ballot with City Council contests. The next unofficial election results update is scheduled for 5:00 p.m. today, Wednesday, June 22, 2022.
To put a turnout of 19,396 into context it is useful to look at the table below, which shows a 20% dropoff of very close to 3,500 votes from Measure H to the fourth highest of the June elections. Bottom-line, now that the votes are in, the story line of low turnout in this election doesn’t hold water.

Timing
Thanks to the data provided by the Political Data Intelligence (PDI) website, we know that the timing of when ballots were returned to Yolo Elections in Measure H was unusual. PDI reported a very low number of returned ballots in the first two weeks after the mail-in ballots were sent to voters. Then almost a third of the total ballots arrived in week three, another third of arrived in week four, and the final third arrived on or after Election Day.
What that tells me is that in this election the voters were actually paying close attention to what the Yes on H and No on H campaigns were saying … and in addition they got a drama bonus during the election cycle with all the legal filings and court decisions, which may have resulted in a higher number of voters holding onto their ballots until the very end.
Turnout
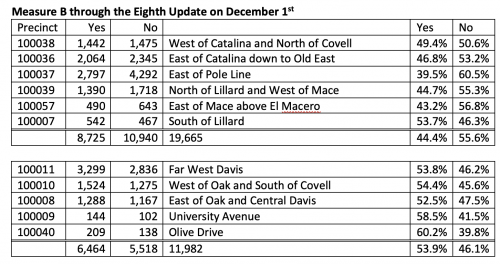
The 19,396 votes in Measure H was 61.3% of the 31,647 Measure B votes in November 2020. The turnout story gets more interesting when you compare the turnout at the consolidated precinct level. The precinct for the northern, eastern and southern portions of Davis (the ones that voted “No” in Measure B), had a Measure H vote count that was 64.2% of its Measure B votes, while the precinct for the western, Downtown and Olive Drive portions of Davis (the ones that voted “Yes” in Measure B), had a Measure H vote count that was only 56.5% of its Measure B votes.
Bottom-line, the parts of Davis that voted “No” in Measure B were much more likely to vote in Measure H than the parts of Davis that voted “Yes” in Measure B.
Yes versus No
As the table below shows, in the northern, eastern and southern portions of Davis the “No” percentage jumped up from 55.6% to 66.6%, while in the western, Downtown and Olive Drive portions of Davis the “No” percentage jumped up from 46.1% to 58.3%. Those are both very substantial and meaningful increases in “No” votes.
But the Yes versus No story doesn’t end there. Looking at the numbers for the people who didn’t vote paints an equally compelling picture. Almost 70% of the missing votes in the western, Downtown and Olive Drive portions of Davis were “Yes” on Measure B (see the first table below). What does that tell us? That the “Yes” votes in November 2020 were very “soft” Yes votes. Arguably, without the draw of the Presidential contest between Trump and Biden, those people probably wouldn’t have voted in the Measure B contest.

The story is the same in the northern, eastern and southern portions of Davis. Just over 64% of the missing votes were “Yes” in Measure B.

That brings us full circle back to the original question posed in this article … What happened? The answer appears to be that the Davis voters take Land Use issues very, very seriously … arguably even more seriously than who gets elected to City Council, but not quite as seriously as who gets elected to the Presidency of the country.
—————————
For those who are interested
The tables below drill down into the individual precincts.


Two thoughts:
1) I’m not sure that voters were holding their ballots to get more information about Measure H as much as the ballot argument lawsuit got enough news and social media attention that they decided to cast a ballot that they wouldn’t have otherwise. That may point to a broader issue to be addressed.
2) The two maps look like far south Davis and Downtown were swapped. Not sure how much of an impact that has, but I expect south Davis to have a lower turnout with a high student population.
In today’s morning comments David Greenwald also continues to maintain the same analysis.
Since I am the guy who proposes all the great things which are somehow impossible – though no studies have gone forward about them – or that our bike share program was racist – but again no one in Davis finds this possible – I will instead propose the following:
The Yes on H side did a lot of polling and prodding and concluded correctly that they were going to lose, so they got Dan Carson* to do the lawsuit, knowing that would it backfire… so they could blame the loss on it! Perhaps I have too big an imagination, know political history too well, study the current machinations of UC Davis administration too closely, and am not really beholden to anyone aside from my murdered ancestors…. and so this is just my fantasy based on my love for equity and justice.
*I don’t know if he was conscious of this or not.
Amusing, but not true.
There’s no smoking gun, but perhaps what’s more interesting is if people think that it’s possible, given what they know of the involved characters or “truths” in the many misleading Yes on H marketing messages.
Was the loss because it was a bad project, because Carson over-stepped and/or more specifically because enough people simply do not trust the developer and (some of) the Council on this matter?
One benchmark is the is the difference between the results in 2020 versus now despite it being half the size. On paper, you would have expected the project to do better all other things being equal. So why would it do so much worse? The most obvious answer – Dan Carson’s actions. Add to that deduction, the anecdotal evidence from people around town who complained about Carson’s “lawsuit” and that’s the most reasonable explanation.
Two interesting questions I have gotten are as follows:
.
Todd may have been getting at that bolded question in his comments above. The second question was …
“Will the current City Council and upcoming Candidates for the three City Council positions “listen”? What’s needed is truly forward-thinking, innovative, imaginative and collaborative planning for housing and economic development. ”
I guess one question is – what does it mean to listen? People voted against a project in 2020 narrowly, they came back with a smaller project, they voted no again. So did they not listen the first time?
Second point on “what’s needed…” isn’t that in the eye of the beholder? I would have argued that DiSC was such a forward-thinking, innovative… I suspect it lost more because of people’s concerns about traffic and perhaps conduct of certain councilmembers. I’m skeptical on how many people would have flipped with a different project but would love to see someone come forward with a design that they would approve.
BUT all-in-all it wasn’t an innovative etc project, if it’s innovation that people want. Wasn’t the lipstick on a pig thing used elsewhere in the recent domination games?
About 2020 vs. 2022, it seems that there were also differences in relation to COVID as perspectives had changed since Measure B, differences that were not sorted or processed much earlier in the pandemic. And my sense is that the marketing was worse this time as far as honesty goes — I’m not talking about the strategy so much.
I arrived in town after Nishi 1.0. I thought it could have worked with a much more imaginative transportation solution connected with re-construction of the 80-Richards interchange. My biggest with both was the proximity to I-80 and the railway, both big sources of a few kinds of pollution. As far as noise goes, now I live further from I-80 and the railway then anyone will (eventually) at Nishi 2.0, but closer than at any time in my life to anything similar. It’s horrible and I don’t wish it open anyone. At least in Manhattan there was a lot of fun activity that actually made the noise more tolerable. So I am also lukewarm about anything on Olive Dr, which is sad because it has still has the roots of a convivial, old-timey street.
I opposed Bretton Woods because it now has the most pretentious name of any housing development in the known Universe – and I am from L.A. so that says a lot! – okay, sure it was WDAAC at the time – because it basically contravenes every progressive article about elder and near-elder life in today’s cities, per AARP’s publications. Moving people to the periphery who will soon become unable to drive themselves nor walk long-distances is a kind of modern day white crime.
Sterling-5th should have been taller and had less parking, and the subsidized children next door should be able to use their pool.
What became Davis Live! – what is it about projects in Davis that change their names before and after votes or approval? – I like in terms of density and proximity, but by-the-bed style in our wealthy land is pretty screwed up.
“BUT all-in-all it wasn’t an innovative etc project,”
Isn’t that a subjective standard?